images
A library of publicly available images
This repository provides links to a library of images which I have used in my research, and can be reused subject to the license conditions. Click on the images for the full size versions.
Wearable Sensors
Wireless Wrist Pulse Oximeter

A photo of a WristOx2®, Model 3150 Wrist-worn Pulse Oximeter.
Source: P. H. Charlton, The Processes and Benefits of Sharing Clinical Data, Science and Engineering South Data Dialogue Event, Cambridge, UK, 2016. DOI: 10.5281/zenodo.166546
License: Creative Commons Attribution 4.0
Respiratory Rate Estimation
Respiratory Modulations of the electrocardiogram (ECG) and photoplethysmogram (PPG)

A diagram of three idealised respiratory modulations of the ECG and PPG: baseline wander (BW), amplitude modulation (AM) and frequency modulation (FM). Note that the Matlab ® code used to create this image is available here.
Source: P. H. Charlton and T. Bonnici et al., An assessment of algorithms to estimate respiratory rate from the electrocardiogram and photoplethysmogram, Physiological Measurement, vol. 37(4), 2016. DOI: 10.1088/0967-3334/37/4/610
License: Creative Commons Attribution 3.0
Extraction of respiratory signals from the photoplethysmogram (PPG)

A diagram of the extraction of respiratory signals from the PPG. Note that the Matlab ® code used to create this image is available here.
Source: P. H. Charlton and T. Bonnici et al., Extraction of respiratory signals from the electrocardiogram and photoplethysmogram: technical and physiological determinants, Physiological Measurement, 38(5), 2017. DOI: 10.1088/1361-6579/aa670e
License: Creative Commons Attribution 3.0
Feature-based extraction of respiratory signals from the electrocardiogram (ECG) and photoplethysmogram (PPG)
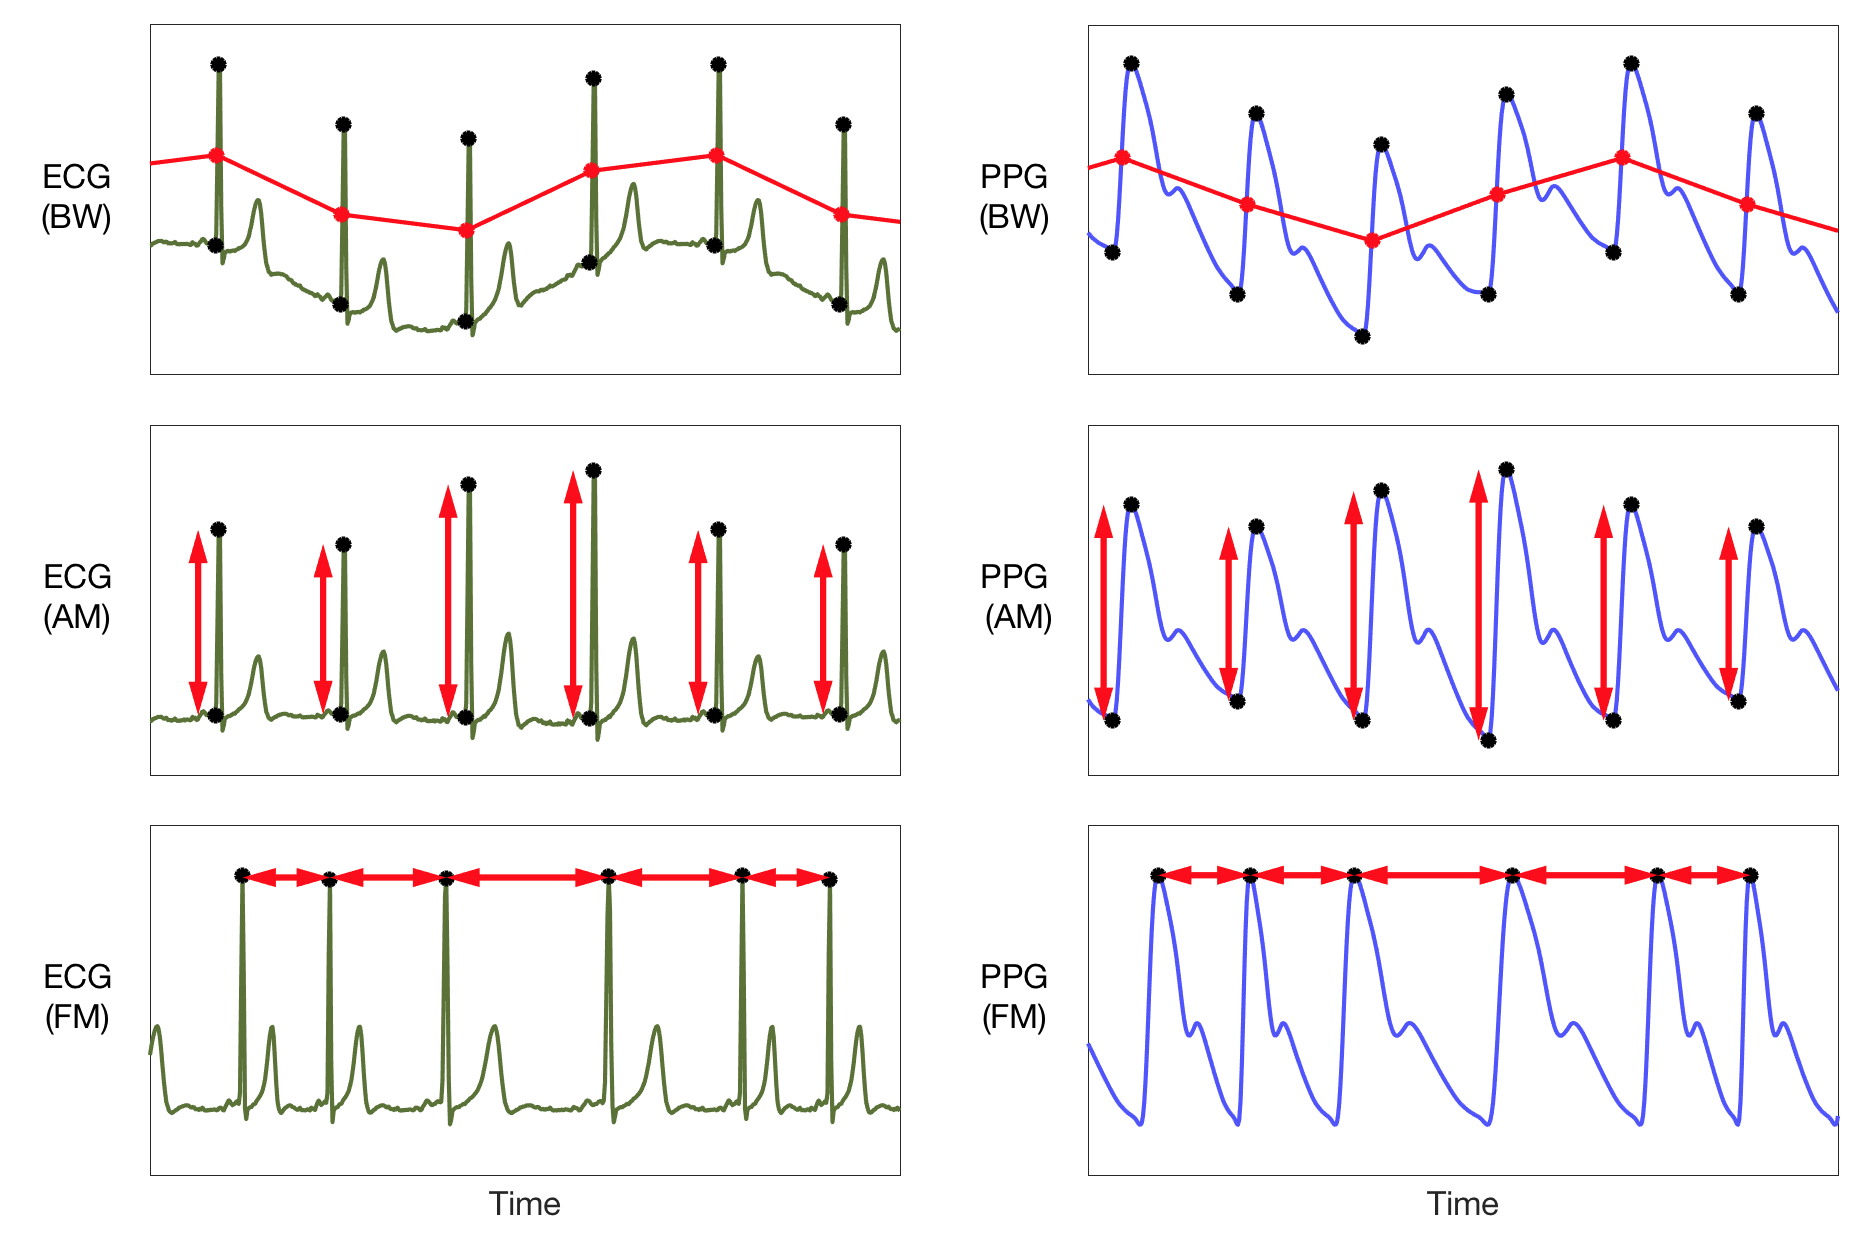
A diagram of feature-based extraction of respiratory signals from the ECG and PPG. Measurements of baseline wander (BW), amplitude modulation (AM) and frequency modulation (FM) have been extracted for each beat from fiducial points (shown as dots). Note that the Matlab ® code used to create this image is available here.
Source: P. H. Charlton et al., Breathing Rate Estimation from the Electrocardiogram and Photoplethysmogram: A Review, IEEE Reviews in Biomedical Engineering, 2017, Fig. 4. DOI: 10.1109/RBME.2017.2763681
License: Creative Commons Attribution 3.0
The Photoplethysmogram (PPG) signal
Comparison of photoplethysmogram (PPG) signals acquired at rest and whilst walking

A diagram comparing photoplethysmogram (PPG) signals from a young, healthy volunteer whilst at rest, and whilst walking. Note that the Matlab ® code used to create this image is available here.
Adapted from: M. A. F. Pimentel et al., Probabilistic estimation of respiratory rate from wearable sensors. In Wearable Electronics Sensors; Mukhopadhyay, S. C., Ed.; Springer International Publishing, 2015; Vol. 15, pp. 241–62, Fig. 1. DOI: 10.1007/978-3-319-18191-2_10
Please cite this article when using this image, saying that it has been adapted.
Origins of the photoplethysmogram (PPG) signal


A pair of diagrams illustrating the simplified origins of light attenuation which form the PPG signal (arterial blood, venous blood and other tissues). Note that the Matlab ® code used to create this image is available here.
Adapted from slide 7 of: Peter H Charlton. (2018, August). Capitalising on Smart Wearables to Improve Health Monitoring. Zenodo. DOI: 10.5281/zenodo.1406011
Please cite this presentation when using this image, saying that it has been adapted.