Physiology
This section provides an overview of the physiology of ECG and PPG signals which underpins both cuffless blood pressure estimation and the assessment of vascular age.
Arterial stiffness, pulse wave velocity, blood pressure and vascular ageing
Arterial stiffness and pulse wave velocity are strongly related. ‘Arterial stiffness’ (the stiffness of arterial walls) is a key determinant of pulse wave velocity (PWV, the speed at which the pulse wave travels from the heart to the periphery). PWV increases with arterial stiffness, as expressed in the Moens-Korteweg equation (see here). Arterial stiffness and PWV increase with age (see here): this is an aspect of vascular ageing.
Blood pressure is also related, because arterial stiffness (and consequently PWV) increase with blood pressure. This is because as blood pressure increases, the arterial walls stretch further, and stiffness of the arterial walls increases as they distend.
Blood pressure and vascular ageing can be assessed from ECG and PPG signals based on these changes in arterial stiffness and PWV. Blood pressure can be estimated from ECG and PPG signals because blood pressure is linked to PWV, which in turn influences these signals. As blood pressure increases, the stiffness of the arteries increases, and therefore the speed at which the pulse wave travels from the heart to the periphery (the pulse wave velocity) increases. Therefore, blood pressure can be estimated from the time taken for the pulse wave to travel through the arteries. Similarly, the impact of vascular ageing on arterial stiffness can be assessed from this time delay.
Electrocardiogram (ECG)
The electrocardiogram (ECG) (introduced in the Electrocardiogram Section) can be used to identify the time of the electrical impulse which initiates ventricular contraction and occurs shortly before blood is ejected from the heart into the aorta. This is indicated by the R-wave, which is the dominant feature of an ECG signal, as shown in Fig. 17.

Fig. 17 ECG waves. Source: Agateller (Anthony Atkielski), Sinus rhythm labels, Wikimedia Commons (Public Domain).
Therefore, the ECG provides a useful marker of the approximate time of the heart beating, but it has the limitation that it doesn’t provide the exact time at which blood is pumped into the circulation. Instead, it provides an earlier time, which precedes the actual time of blood being pumped by a short time known as the ‘pre-ejection period’ (see here for further details).
Photoplethysmogram (PPG)
The photoplethysmogram (PPG) (introduced in the Photoplethysmogram Section) can be used to identify the time at which the arterial pulse wave arrives at the measurement site. As shown in Fig. 18, the PPG signal is dominated by variations in arterial blood volume which occur when the pulse wave arrives at the measurement site. The time at which the pulse wave arrives can be obtained from the onset of the PPG pulse wave (i.e. the start of the upslope).

Fig. 18 The origins of the Photoplethysmogram (PPG) signal. Source: Charlton PH, Photoplethysmogram signal components, Wikimedia Commons (CC BY 4.0).
Blood pressure estimation
Broadly, there are three approaches for cuffless blood pressure estimation, as illustrated in Fig. 19. These are based on the observation that the speed with which the pulse wave propagates increases with blood pressure (linked via arterial stiffness):
measuring the pulse transit time (PTT) between two arterial pulse waves (one closer to the heart and one further away).
measuring the pulse arrival time (PAT) between a marker of ventricular contraction, and the arrival of a pulse wave (preferably at a peripheral site)
estimating BP from the shape of a pulse wave (such as a photoplethysmography, PPG, pulse wave), since changes in pulse wave velocity and BP influence the shapes of pulse waves.
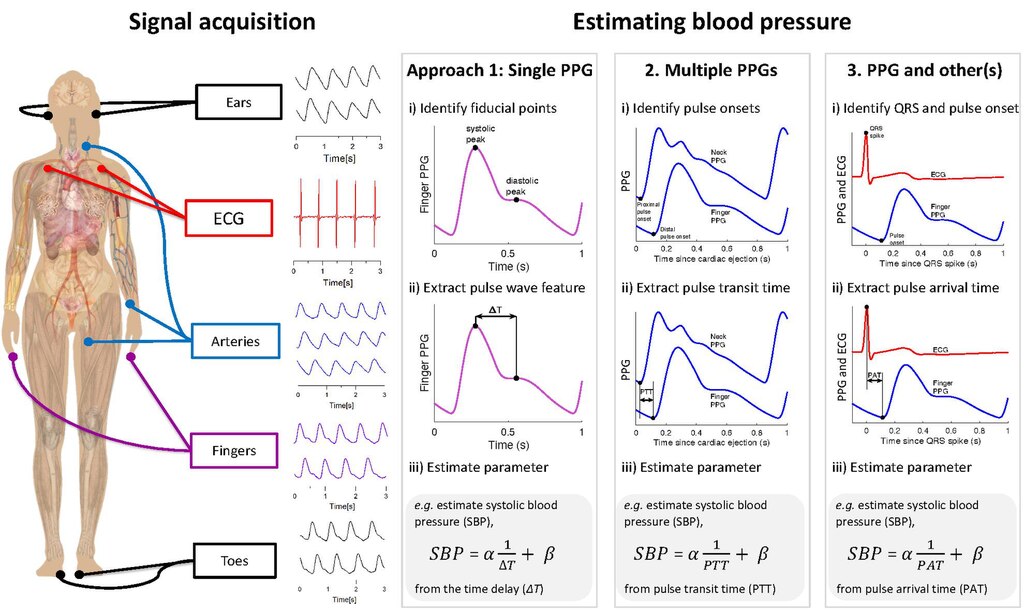
Fig. 19 Three approaches to estimate blood pressure from ECG and PPG signals. Source: PH Charlton, Estimating blood pressure from the photoplethysmogram, CC BY 4.0.
Vascular age assessment
Similarly to blood pressure estimation, there are broadly three approaches to assessing vascular age from PPG and ECG signals, as illustrated in Fig. 20. These are based on the observation that the speed with which the pulse wave propagates increases with blood pressure (linked via arterial stiffness):
measuring the pulse transit time (PTT) between two arterial pulse waves (one closer to the heart and one further away).
measuring the pulse arrival time (PAT) between a marker of ventricular contraction, and the arrival of a pulse wave (preferably at a peripheral site)
estimating BP from the shape of a pulse wave (such as a photoplethysmography, PPG, pulse wave), since changes in pulse wave velocity influence the shapes of pulse waves.
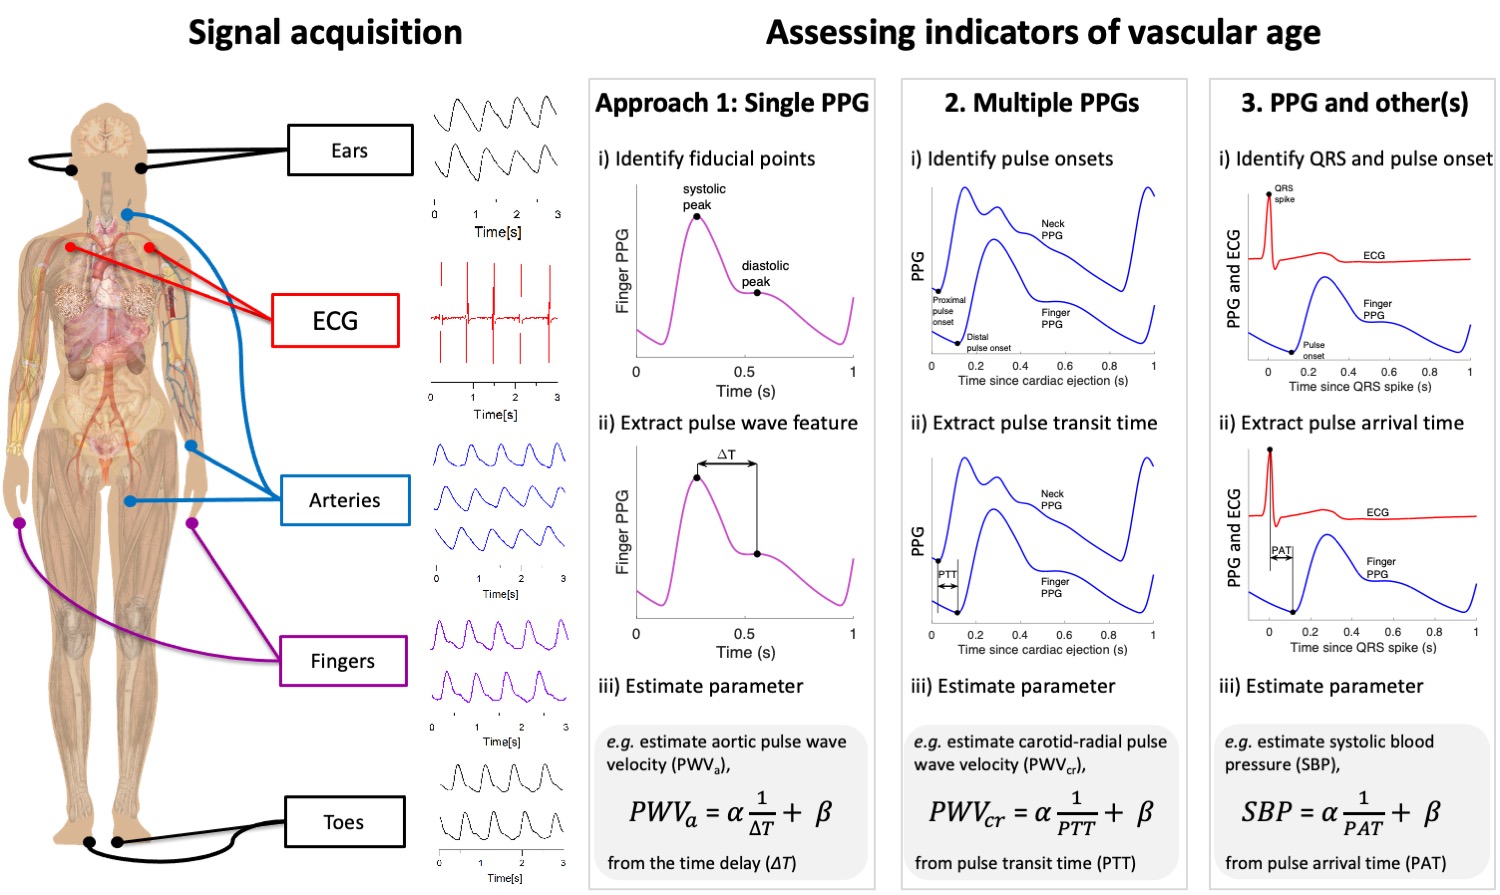
Fig. 20 Three approaches to assessing vascular age from ECG and PPG signals. Source: PH Charlton et al., Assessing hemodynamics from the photoplethysmogram to gain insights into vascular age: a review from VascAgeNet, CC BY 4.0.
Parameters
The three approaches to estimate blood pressure or assess vascular age from ECG and PPG signals are now described.
Pulse transit time
Blood pressure and vascular ageing can be assessed from the pulse transit time, the time delay between two PPG pulse waves, where one is measured closer to the heart, and one further away. This pulse transit time is related to pulse wave velocity:
Pulse wave velocity is in turn related to blood pressure. The distance travelled by the pulse wave between the two PPG measurement sites is often unknown, introducing additional uncertainty into the relationship between the measured pulse transit time and the true blood pressure or arterial stiffness.
Pulse arrival time
Blood pressure and vascular ageing can be assessed from the pulse arrival time, the time delay between the ECG R-wave and the arrival of a PPG pulse wave. The pulse arrival time is related to pulse transit time by:
The pre-ejection period can vary both between subjects, and also over time for an individual subject. Consequently, the use of pulse arrival time introduces additional uncertainty into the assessment of blood pressure or arterial stiffness beyond that of using pulse transit time.
Pulse wave shape
Blood pressure and vascular ageing can be assessed from the shape of a PPG pulse wave. The shape of the pulse wave changes with vascular ageing and blood pressure as demonstrated in Fig. 21. The higher classes are associated with older subjects and higher blood pressures.

Fig. 21 Classes of PPG pulse wave shape. Source: PH Charlton, Classes of photoplethysmogram (PPG) pulse wave shape, CC BY 4.0.
_pulse_wave_shape.svg)