Exploring PTT-PPG
Let’s begin by exploring data in the Pulse Transit Time PPG dataset.
Our objectives are to:
Understand what records are present in the dataset.
Find out which signals are present in a record, and how long the signals last.
Load waveforms using the WFDB toolbox.
Plot the waveforms
Resource: You can find out more about the Pulse Transit Time PPG dataset here.
Setup
Specify the required Python packages
We’ll import the following:
sys: an essential python package
pathlib (well a particular function from pathlib, called Path)
import sys
from pathlib import Path
Specify a particular version of the WFDB Toolbox
wfdb: For this workshop we will be using version 4 of the WaveForm DataBase (WFDB) Toolbox package. The package contains tools for processing waveform data such as those found in this dataset:
!pip install wfdb==4.1.0
import wfdb
Requirement already satisfied: wfdb==4.1.0 in /Users/petercharlton/anaconda3/lib/python3.8/site-packages (4.1.0)
Requirement already satisfied: pandas<2.0.0,>=1.0.0 in /Users/petercharlton/anaconda3/lib/python3.8/site-packages (from wfdb==4.1.0) (1.2.4)
Requirement already satisfied: requests<3.0.0,>=2.8.1 in /Users/petercharlton/anaconda3/lib/python3.8/site-packages (from wfdb==4.1.0) (2.25.1)
Requirement already satisfied: numpy<2.0.0,>=1.10.1 in /Users/petercharlton/anaconda3/lib/python3.8/site-packages (from wfdb==4.1.0) (1.20.1)
Requirement already satisfied: matplotlib<4.0.0,>=3.2.2 in /Users/petercharlton/anaconda3/lib/python3.8/site-packages (from wfdb==4.1.0) (3.3.4)
Requirement already satisfied: scipy<2.0.0,>=1.0.0 in /Users/petercharlton/anaconda3/lib/python3.8/site-packages (from wfdb==4.1.0) (1.6.2)
Requirement already satisfied: SoundFile<0.12.0,>=0.10.0 in /Users/petercharlton/anaconda3/lib/python3.8/site-packages (from wfdb==4.1.0) (0.10.3.post1)
Requirement already satisfied: python-dateutil>=2.1 in /Users/petercharlton/anaconda3/lib/python3.8/site-packages (from matplotlib<4.0.0,>=3.2.2->wfdb==4.1.0) (2.8.1)
Requirement already satisfied: cycler>=0.10 in /Users/petercharlton/anaconda3/lib/python3.8/site-packages (from matplotlib<4.0.0,>=3.2.2->wfdb==4.1.0) (0.10.0)
Requirement already satisfied: pyparsing!=2.0.4,!=2.1.2,!=2.1.6,>=2.0.3 in /Users/petercharlton/anaconda3/lib/python3.8/site-packages (from matplotlib<4.0.0,>=3.2.2->wfdb==4.1.0) (2.4.7)
Requirement already satisfied: pillow>=6.2.0 in /Users/petercharlton/anaconda3/lib/python3.8/site-packages (from matplotlib<4.0.0,>=3.2.2->wfdb==4.1.0) (8.2.0)
Requirement already satisfied: kiwisolver>=1.0.1 in /Users/petercharlton/anaconda3/lib/python3.8/site-packages (from matplotlib<4.0.0,>=3.2.2->wfdb==4.1.0) (1.3.1)
Requirement already satisfied: six in /Users/petercharlton/anaconda3/lib/python3.8/site-packages (from cycler>=0.10->matplotlib<4.0.0,>=3.2.2->wfdb==4.1.0) (1.15.0)
Requirement already satisfied: pytz>=2017.3 in /Users/petercharlton/anaconda3/lib/python3.8/site-packages (from pandas<2.0.0,>=1.0.0->wfdb==4.1.0) (2021.1)
Requirement already satisfied: chardet<5,>=3.0.2 in /Users/petercharlton/anaconda3/lib/python3.8/site-packages (from requests<3.0.0,>=2.8.1->wfdb==4.1.0) (4.0.0)
Requirement already satisfied: idna<3,>=2.5 in /Users/petercharlton/anaconda3/lib/python3.8/site-packages (from requests<3.0.0,>=2.8.1->wfdb==4.1.0) (2.10)
Requirement already satisfied: certifi>=2017.4.17 in /Users/petercharlton/anaconda3/lib/python3.8/site-packages (from requests<3.0.0,>=2.8.1->wfdb==4.1.0) (2022.12.7)
Requirement already satisfied: urllib3<1.27,>=1.21.1 in /Users/petercharlton/anaconda3/lib/python3.8/site-packages (from requests<3.0.0,>=2.8.1->wfdb==4.1.0) (1.26.4)
Requirement already satisfied: cffi>=1.0 in /Users/petercharlton/anaconda3/lib/python3.8/site-packages (from SoundFile<0.12.0,>=0.10.0->wfdb==4.1.0) (1.14.5)
Requirement already satisfied: pycparser in /Users/petercharlton/anaconda3/lib/python3.8/site-packages (from cffi>=1.0->SoundFile<0.12.0,>=0.10.0->wfdb==4.1.0) (2.20)
Resource: You can find out more about the WFDB package here.
Now that we have imported these packages (i.e. toolboxes) we have a set of tools (functions) ready to use.
Specify the name of the Database
Specify the name of the database on Physionet, which comes from the URL: https://physionet.org/content/pulse-transit-time-ppg/1.1.0/
database_name = 'pulse-transit-time-ppg/1.1.0'
Identify the records in the database
Get a list of records
Use the
get_record_listfunction from the WFDB toolbox to get a list of records in the database.
record_list = wfdb.get_record_list(database_name)
print(f"The '{database_name}' database contains {len(record_list)} records")
The 'pulse-transit-time-ppg/1.1.0' database contains 66 records
Look at the records
Display the first few records
# format and print first six records
no_records = 6
first_records = [str(x) for x in record_list[0:no_records]]
first_records = "\n - ".join(first_records)
print(f"First records: \n - {first_records}")

print("""
Note the formatting of the record names:
 - subject (e.g. 's1')
 - activity (e.g. 'run')
 """)
First records:
 - s1_walk
 - s1_run
 - s1_sit
 - s2_walk
 - s2_run
 - s2_sit

Note the formatting of the record names:
 - subject (e.g. 's1')
 - activity (e.g. 'run')
Q: Can you print the names of the last five records?
Hint: in Python, the last five elements can be specified using '[-5:]'
Extract metadata for a record
Each record contains metadata stored in a header file, named “<record name>.hea”
Load the metadata for a record
Use the
rdheaderfunction from the WFDB toolbox to load metadata from the record header file
idx = 3
record = record_list[idx]
record_data = wfdb.rdheader(record, pn_dir=database_name)
remote_url = "https://physionet.org/content/" + database_name + "/" + record + ".hea"
print(f"Done: metadata loaded for record '{record}' from the header file at:\n{remote_url}")
Done: metadata loaded for record 's2_walk' from the header file at:
https://physionet.org/content/pulse-transit-time-ppg/1.1.0/s2_walk.hea
Inspect details of physiological signals recorded in this record
Printing a few details of the signals from the extracted metadata
print(f"- Number of signals: {record_data.n_sig}".format())
print(f"- Duration: {record_data.sig_len/(record_data.fs*60):.1f} minutes")
print(f"- Base sampling frequency: {record_data.fs} Hz")
print(f"\nThis record contains the following signals: {record_data.sig_name}")
print(f"\nThe signals are measured in units of: {record_data.units}")
- Number of signals: 18
- Duration: 8.2 minutes
- Base sampling frequency: 500 Hz

This record contains the following signals: ['ecg', 'pleth_1', 'pleth_2', 'pleth_3', 'pleth_4', 'pleth_5', 'pleth_6', 'lc_1', 'lc_2', 'temp_1', 'temp_2', 'temp_3', 'a_x', 'a_y', 'a_z', 'g_x', 'g_y', 'g_z']

The signals are measured in units of: ['mV', 'NU', 'NU', 'NU', 'NU', 'NU', 'NU', 'NU', 'NU', 'C', 'C', 'C', 'g', 'g', 'g', 'deg/s', 'deg/s', 'deg/s']
See here for definitions of signal abbreviations.
Find out how long each signal lasts
All signals in a segment are time-aligned, measured at the same sampling frequency, and last the same duration:
print(f"The signals have a base sampling frequency of {record_data.fs:.1f} Hz")
print(f"and they last for {record_data.sig_len/(record_data.fs*60):.1f} minutes")
The signals have a base sampling frequency of 500.0 Hz
and they last for 8.2 minutes
Identify records suitable for analysis
Specify requirements
Required signals
required_sigs = ['ecg', 'pleth_1']
Required duration
# convert from minutes to seconds
req_seg_duration = 1*60
Required activity
req_activity = "sit"
Find out how many records meet the requirements
matching_recs = {'dir':[], 'name':[], 'length':[], 'start_sbp':[], 'end_sbp':[], 'delta_sbp':[]}

for record in record_list:
    print('Record: {}'.format(record), end="", flush=True)

    # check whether this record corresponds to a suitable activity
    if not req_activity in record:
        print('   (not required activity)')
        continue

    record_data = wfdb.rdheader(record,
                                pn_dir=database_name,
                                rd_segments=True)

    # Check whether the required signals are present in the record
    sigs_present = record_data.sig_name
    if not all(x in sigs_present for x in required_sigs):
        print('   (missing signals)')
        continue

    seg_length = record_data.sig_len/(record_data.fs)

    if seg_length < req_seg_duration:
        print(f' (too short at {seg_length/60:.1f} mins)')
        continue

    # This record does meet the requirements, so extract information and data from it

    # Information
    matching_recs['dir'].append(database_name)
    matching_recs['name'].append(record_data.record_name)
    matching_recs['length'].append(seg_length)

    # Blood pressure measurements
    str_to_find = '<bp_sys_start>: '
    curr_len = len(str_to_find)
    start_el = record_data.comments[0].index(str_to_find) + curr_len
    str_to_find = '<bp_sys_end>'
    len(str_to_find)
    end_el = record_data.comments[0].index(str_to_find) - 1
    matching_recs['start_sbp'].append(int(record_data.comments[0][start_el:end_el]))
    str_to_find = '<bp_sys_end>: '
    curr_len = len(str_to_find)
    start_el = record_data.comments[0].index(str_to_find) + curr_len
    str_to_find = '<bp_dia_start>'
    len(str_to_find)
    end_el = record_data.comments[0].index(str_to_find) - 1
    matching_recs['end_sbp'].append(int(record_data.comments[0][start_el:end_el]))
    matching_recs['delta_sbp'].append(matching_recs['end_sbp'][-1]-matching_recs['start_sbp'][-1])

    print('   (met requirements)')

print(f"A total of {len(matching_recs['dir'])} out of {len(record_list)} records met the requirements.")
Record: s1_walk   (not required activity)
Record: s1_run   (not required activity)
Record: s1_sit   (met requirements)
Record: s2_walk   (not required activity)
Record: s2_run   (not required activity)
Record: s2_sit   (met requirements)
Record: s3_sit   (met requirements)
Record: s3_walk   (not required activity)
Record: s3_run   (not required activity)
Record: s4_sit   (met requirements)
Record: s4_run   (not required activity)
Record: s4_walk   (not required activity)
Record: s5_walk   (not required activity)
Record: s5_run   (not required activity)
Record: s5_sit   (met requirements)
Record: s6_run   (not required activity)
Record: s6_sit   (met requirements)
Record: s6_walk   (not required activity)
Record: s7_walk   (not required activity)
Record: s7_run   (not required activity)
Record: s7_sit   (met requirements)
Record: s8_sit   (met requirements)
Record: s8_run   (not required activity)
Record: s8_walk   (not required activity)
Record: s9_walk   (not required activity)
Record: s9_sit   (met requirements)
Record: s9_run   (not required activity)
Record: s10_run   (not required activity)
Record: s10_walk   (not required activity)
Record: s10_sit   (met requirements)
Record: s11_sit   (met requirements)
Record: s11_walk   (not required activity)
Record: s11_run   (not required activity)
Record: s12_walk   (not required activity)
Record: s12_run   (not required activity)
Record: s12_sit   (met requirements)
Record: s13_walk   (not required activity)
Record: s13_sit   (met requirements)
Record: s13_run   (not required activity)
Record: s14_run   (not required activity)
Record: s14_walk   (not required activity)
Record: s14_sit   (met requirements)
Record: s15_walk   (not required activity)
Record: s15_sit   (met requirements)
Record: s15_run   (not required activity)
Record: s16_sit   (met requirements)
Record: s16_run   (not required activity)
Record: s16_walk   (not required activity)
Record: s17_run   (not required activity)
Record: s17_walk   (not required activity)
Record: s17_sit   (met requirements)
Record: s18_run   (not required activity)
Record: s18_walk   (not required activity)
Record: s18_sit   (met requirements)
Record: s19_walk   (not required activity)
Record: s19_sit   (met requirements)
Record: s19_run   (not required activity)
Record: s20_run   (not required activity)
Record: s20_walk   (not required activity)
Record: s20_sit   (met requirements)
Record: s21_walk   (not required activity)
Record: s21_sit   (met requirements)
Record: s21_run   (not required activity)
Record: s22_walk   (not required activity)
Record: s22_run   (not required activity)
Record: s22_sit   (met requirements)
A total of 22 out of 66 records met the requirements.
Question: Is this enough data for a study? Consider different types of studies, e.g. assessing the performance of a previously proposed algorithm to estimate BP from the PPG signal, vs. developing a deep learning approach to estimate BP from the PPG.
Exploring the data
Import the matplotlib package for plotting
from matplotlib import pyplot as plt
import numpy as np
Blood pressure measurements
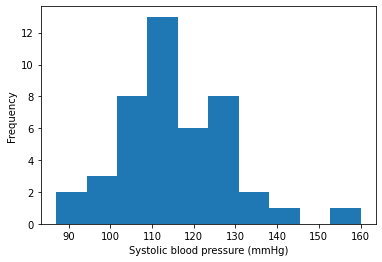
Display blood pressure measurements
bp = np.concatenate((matching_recs['start_sbp'], matching_recs['end_sbp']))
plt.hist(bp)
plt.xlabel('Systolic blood pressure (mmHg)')
plt.ylabel('Frequency')
Text(0, 0.5, 'Frequency')
bp = matching_recs['delta_sbp']
plt.hist(bp)
plt.xlabel('$\Delta$ Systolic blood pressure (mmHg)')
plt.ylabel('Frequency')
Text(0, 0.5, 'Frequency')
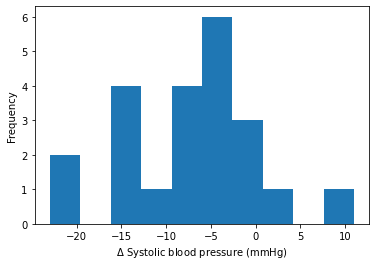
Display changes in blood pressure measurements between start and end of activity
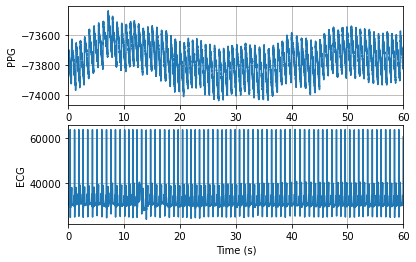
Inspect signals
start_seconds = 0
n_seconds_to_load = 60
rec_no = 0
record_name = matching_recs['name'][0]
record_dir = matching_recs['dir'][0]
record_data = wfdb.rdheader(record_name,
                            pn_dir=record_dir,
                            rd_segments=True)
fs = record_data.fs
sampfrom = fs * start_seconds
sampto = fs * (start_seconds + n_seconds_to_load)

segment_data = wfdb.rdrecord(record_name=record_name,
                             channel_names = ['ecg','pleth_2'],
                             sampfrom=sampfrom,
                             sampto=sampto,
                             pn_dir=record_dir)

print(f"{n_seconds_to_load} seconds of data extracted from segment: {record_name}")
60 seconds of data extracted from segment: s1_sit
sig_no = segment_data.sig_name.index('pleth_2')
ppg = -1*segment_data.p_signal[:,sig_no]
fs = segment_data.fs
t = np.arange(0, (len(ppg) / fs), 1.0 / fs)

sig_no = segment_data.sig_name.index('ecg')
ecg = segment_data.p_signal[:,sig_no]

fig, axs = plt.subplots(2, 1)
axs[0].plot(t, ppg)
axs[0].set_xlim(0, n_seconds_to_load)
axs[0].set_xlabel('Time (s)')
axs[0].set_ylabel('PPG')
axs[0].grid(True)

axs[1].plot(t, ecg)
axs[1].set_xlim(0, n_seconds_to_load)
axs[1].set_xlabel('Time (s)')
axs[1].set_ylabel('ECG')
axs[1].grid(True)

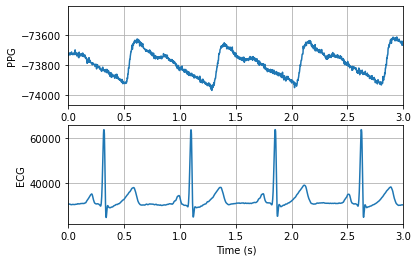
fig, axs = plt.subplots(2, 1)
axs[0].plot(t, ppg)
axs[0].set_xlim(0, 3)
axs[0].set_xlabel('Time (s)')
axs[0].set_ylabel('PPG')
axs[0].grid(True)

axs[1].plot(t, ecg)
axs[1].set_xlim(0, 3)
axs[1].set_xlabel('Time (s)')
axs[1].set_ylabel('ECG')
axs[1].grid(True)
Plot frequency spectra of signals
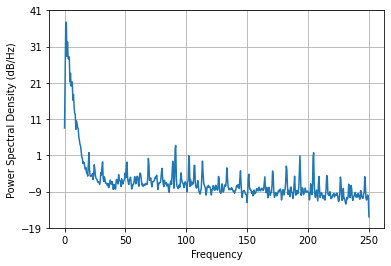
Now we’re going to plot the frequency spectrum of the PPG signal.
from scipy import signal
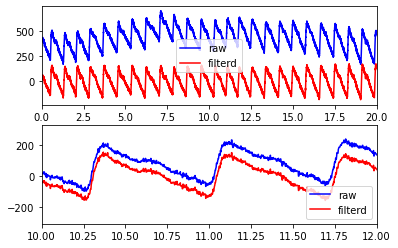
First, let’s filter the signal to eliminate very low frequencies which would otherwise dominate the power spectrum.
# Specify cutoffs in Hertz
hpf_cutoff = 0.5

# create high-pass filter
sos_ppg = signal.butter(4,
                    hpf_cutoff,
                    btype = 'highpass',
                    analog = False,
                    output = 'sos',
                    fs = segment_data.fs)

#  high-pass filter
ppg_filt = signal.sosfiltfilt(sos_ppg, ppg)

# plot results
fig, axs = plt.subplots(2, 1)
axs[0].plot(t, 400+signal.detrend(ppg), color='blue', label='raw')
axs[0].plot(t, ppg_filt, color='red', label='filterd')
axs[0].set_xlim(0, 20)
axs[0].legend()

axs[1].plot(t, signal.detrend(ppg), color='blue', label='raw')
axs[1].plot(t, ppg_filt, color='red', label='filterd')
axs[1].set_xlim(10, 12)
axs[1].legend()
<matplotlib.legend.Legend at 0x7faa795c9070>
Let’s plot the frequency spectrum
Pxx, freqs = plt.psd(ppg_filt, NFFT=1024, Fs=fs)
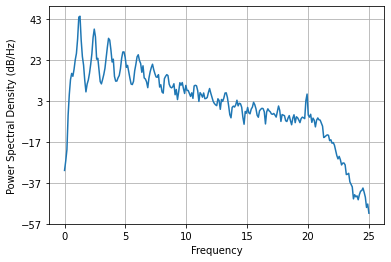
Now let’s focus on the lower, physiological frequencies, by downsampling the signal to a lower sampling frequency.
ds_fs = 50
ppg_ds = signal.decimate(ppg_filt, round(fs/ds_fs))
Pxx, freqs = plt.psd(ppg_ds, NFFT=512, Fs=ds_fs)
Note that this could also be done using scipy:
f, Pxx_spec = signal.welch(ppg_ds, ds_fs, nperseg=512)
plt.semilogy(f, Pxx_spec)
plt.xlabel('frequency [Hz]')
plt.ylabel('PSD [V**2/Hz]')
plt.show()
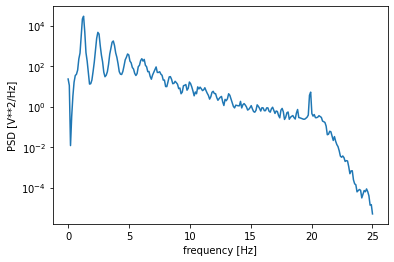
Most of the frequency content is below 7.5 Hz:
total_Pxx_spec = sum(Pxx_spec)
freq_no = 0
curr_sum = 0
while curr_sum < 0.99*total_Pxx_spec:
    curr_sum = curr_sum+Pxx_spec[freq_no]
    freq_no += 1

print('99% of the frequency content is below {} Hz'.format(f[freq_no]))
99% of the frequency content is below 7.32421875 Hz
Let’s repeat for the ECG:
ecg_filt = signal.sosfiltfilt(sos_ppg, ecg)
ds_fs = 100
ecg_ds = signal.decimate(ecg_filt, round(fs/ds_fs))
Pxx, freqs = plt.psd(ecg_ds, NFFT=1024, Fs=ds_fs)
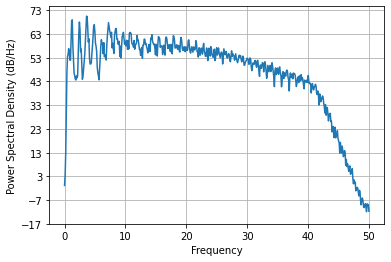
For the ECG, most of the frequency content is below 35 Hz:
f, Pxx_spec = signal.welch(ecg_ds, ds_fs, nperseg=1024)
total_Pxx_spec = sum(Pxx_spec)
freq_no = 0
curr_sum = 0
while curr_sum < 0.99*total_Pxx_spec:
    curr_sum = curr_sum+Pxx_spec[freq_no]
    freq_no += 1

print('99% of the frequency content is below {} Hz'.format(f[freq_no]))
99% of the frequency content is below 33.984375 Hz