Exploring OpenOx
Note: This tutorial is of limited use, as it requires files to be downloaded manually, and then run locally. The OpenOximetry Repository isn't used further in this book.
This is an initial introduction to reading PPG files in the OpenOximetry Repository.
Resource: You can find out more about the OpenOximetry Repository here.
Setup
Specify the required Python packages
We’ll import the following:
os
numpy
matplotlib: for plotting
import os
import matplotlib.pyplot as plt
import numpy as np
Specify a particular version of the WFDB Toolbox
wfdb: For this workshop we will be using version 4 of the WaveForm DataBase (WFDB) Toolbox package. The package contains tools for processing waveform data such as the PPG signals found in the OpenOximetry repository:
!pip install wfdb==4.1.0
import wfdb
Resource: You can find out more about the WFDB package here.
Now that we have imported these packages (i.e. toolboxes) we have a set of tools (functions) ready to use.
Download a WFDB file containing a PPG signal
In preparation for this, I have downloaded the following two files:
0274ff212eab782d3a29b533b78a051984a04469844659e3cab48bab230e2e1d_ppg.dat
0274ff212eab782d3a29b533b78a051984a04469844659e3cab48bab230e2e1d_ppg.hea
I then moved them to a new folder at the following path (if you are repeating this you will need to update this with the path to your own folder):
local_record_dir = '/Users/petercharlton/Downloads/downloaded2/curr_files/'
# Identify all files in the directory
all_files = os.listdir(local_record_dir)

# Filter to get only record files (assuming .dat and .hea files are used for records)
record_files = [f for f in all_files if f.endswith('.dat')]

# Remove the file extension to get the record names
record_names = [os.path.splitext(f)[0] for f in record_files]

print("Local WFDB record names:", record_names)

# Load and process each record
start_sample = 50000  # Replace with your desired start sample index
end_sample = start_sample+10*record.fs    # Replace with your desired end sample index
for record_name in record_names:
    record_path = os.path.join(local_record_dir, record_name)
    record = wfdb.rdrecord(record_path, sampfrom = start_sample, sampto = end_sample)
    num_samples = len(record.p_signal)
    time_vector = np.arange(num_samples) / record.fs
    # Plot the signals
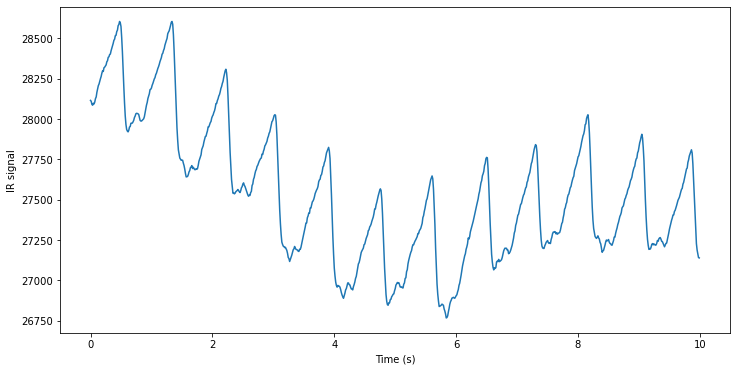
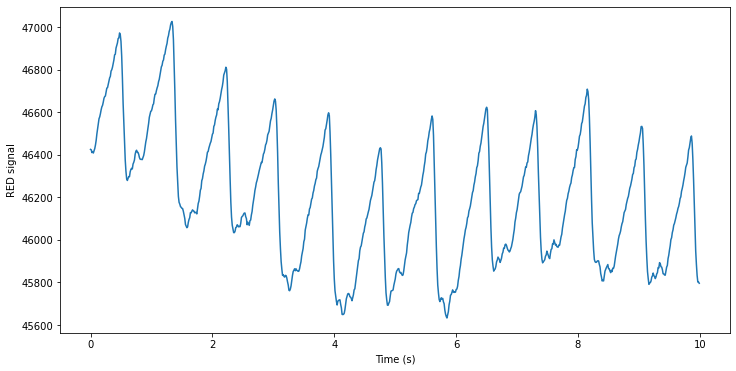
    for i in range(record.n_sig):
        plt.figure(figsize=(12, 6))
        plt.plot(time_vector,record.p_signal[:, i], label=f'Signal {i+1}')
        plt.xlabel('Time (s)')
        plt.ylabel(record.sig_name[i] + ' signal')
Local WFDB record names: ['0274ff212eab782d3a29b533b78a051984a04469844659e3cab48bab230e2e1d_ppg']

