Signals
This book will consider three principal signals acquired by many wearables: acceleration, electrocardiogram, and photoplethysmogram signals.
Acceleration
An accelerometer is used to measure acceleration - the rate of change in velocity. Accelerometers can be used to assess physical activity, such as exercise, posture, and sleep status. They are inexpensive and consume little power, and are widely incorporated into wearables and smartphones.
Tri-axial accelerometers measure acceleration in three orthogonal directions (often seen as the x-, y-, and z-axes on a graph). Fig. 8 shows a 10-second excerpt of tri-axial accelerometer signals during walking. Note that the signal with a mean value of -9.87m/s\(^2\) exhibits twice as many cycles as the other signals. The axis of this signal is approximately vertical (as shown by a mean value of approximately 1 g-force), and it captures the vertical accelerations which occur with each stride. In contrast, the other signals are dominated by the horizontal movement of the arm during walking, and therefore exhibit one peak for every two strides.
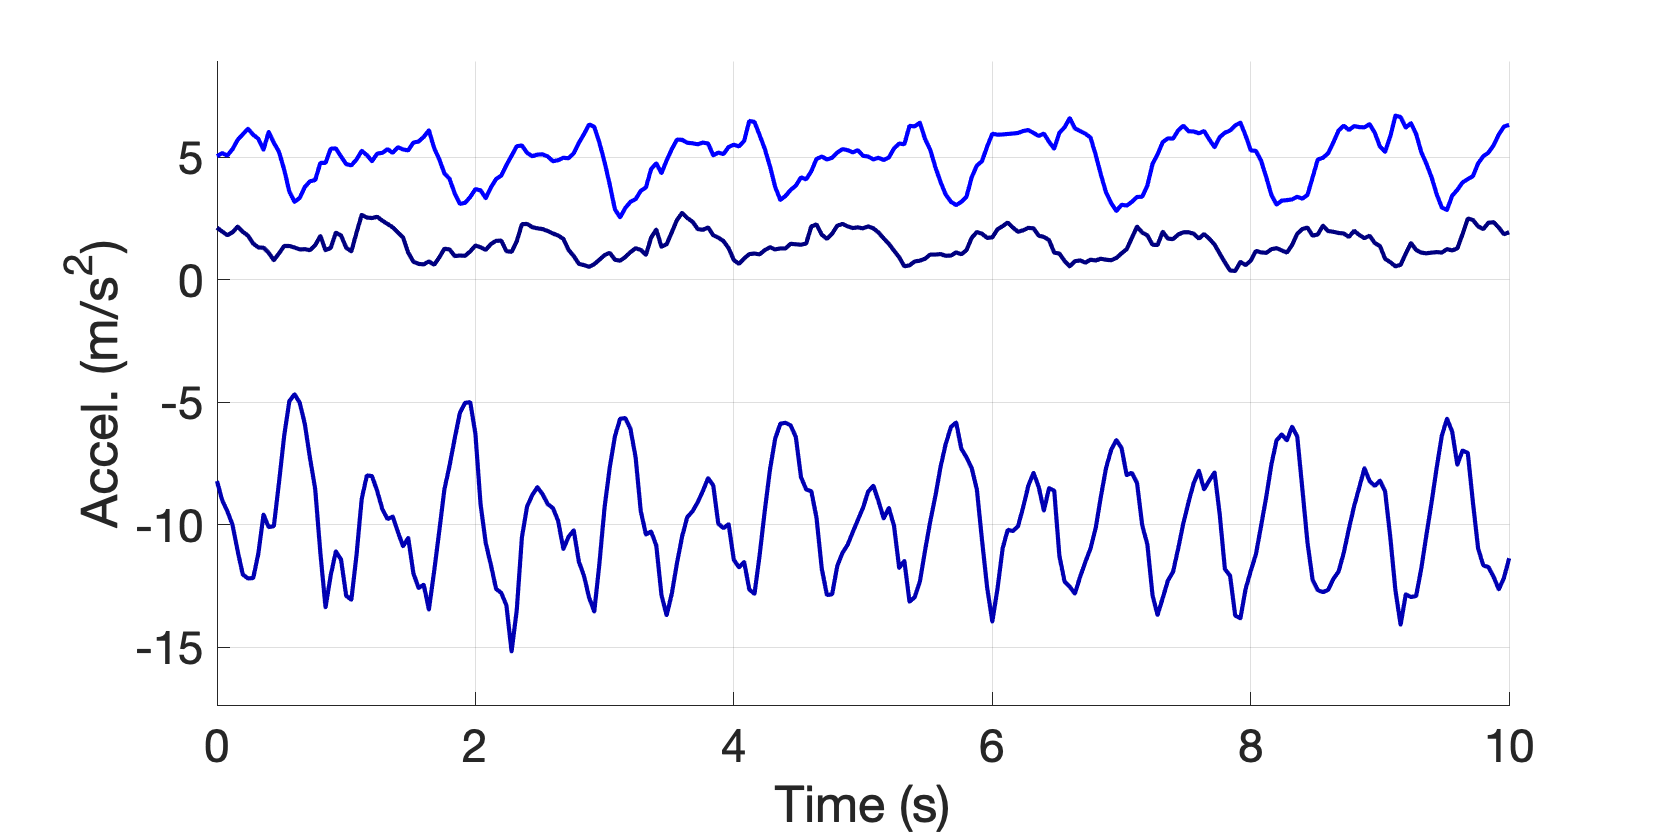
Fig. 8 Tri-axial accelerometer signals during walking. Measured using a PulseOn OHR Tracker.
In some applications, a single accelerometer signal is calculated from the tri-axial signals as the magnitude of the resultant acceleration vector, \(r_i = \sqrt{x_i^2 + y_i^2 + z_i^2}\):
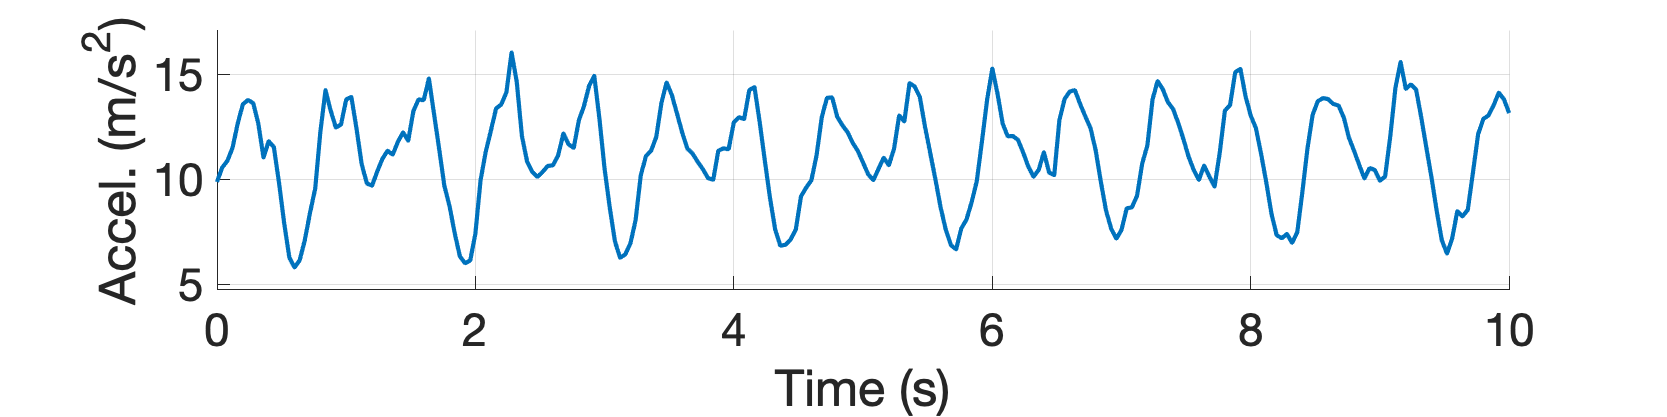
Fig. 9 Resultant accelerometer signal. Measured using a PulseOn OHR Tracker.
A simple application of the accelerometer signal is to classify physical activities. To do so, the ‘mean amplitude deviation’ can be calculated, with increasing values indicating increasing intensity levels (see here for details). The mean amplitude deviation is the mean difference between the resultant acceleration vector and its mean value, \(MAD = \frac{1}{n}\sum_{i=1}^n \left| r_i - \overline{r} \right|\).
For instance, in the example above the MAD is 1.93m/s\(^2\), which corresponds to approximately 197mg\(_0\) (milligravitational units). Using the look-up table below (from here), we can see that this corresponds to normal walking:
MAD (mg\(_0\)) |
Activity |
|---|---|
0 - 16.7 |
Sedentary |
16.7 - 157.4 |
Slow walking |
157.4 - 331.2 |
Normal walking |
331.2 - 599.3 |
Brisk walking |
> 599.3 |
Jogging and running |
Electrocardiogram
The electrocardiogram (ECG) is a measure of the heart’s electrical activity. Each time the heart beats a series of electrical currents are generated, indicating the contraction or relaxation of different parts of the heart. Consequently, the ECG provides information on heart rate, heart rhythm, and heart muscle function. The ECG is measured as the voltage difference between two points on the body surface over time. Like accelerometers, ECG sensors are inexpensive and consume little power.
A traditional 12-lead ECG device used in a clinic (such as that shown in Fig. 2) provides 12 simultaneous ECG signals which correspond to different ‘views’ of the heart’s electrical activity (see Fig. 10). Consequently, 12-lead ECGs can be used not only to identify abnormal heart function, but even to identify which part of the heart is not functioning normally. In the 1960s wearable devices (‘Holter’ monitors) were developed which measured a reduced set of ECG signals from electrodes on the chest. These are widely used today for cardiac investigations.

Fig. 10 A 12-lead ECG measurement. Source: Charlton PH, 12 lead ECG (CC BY 4.0)
Recently, single-lead ECG sensors have been incorporated into wrist-worn devices, as shown in Fig. 11. These devices typically have on electrode on the underside, and another on either the side or top of the device which the user touches with their opposite hand.
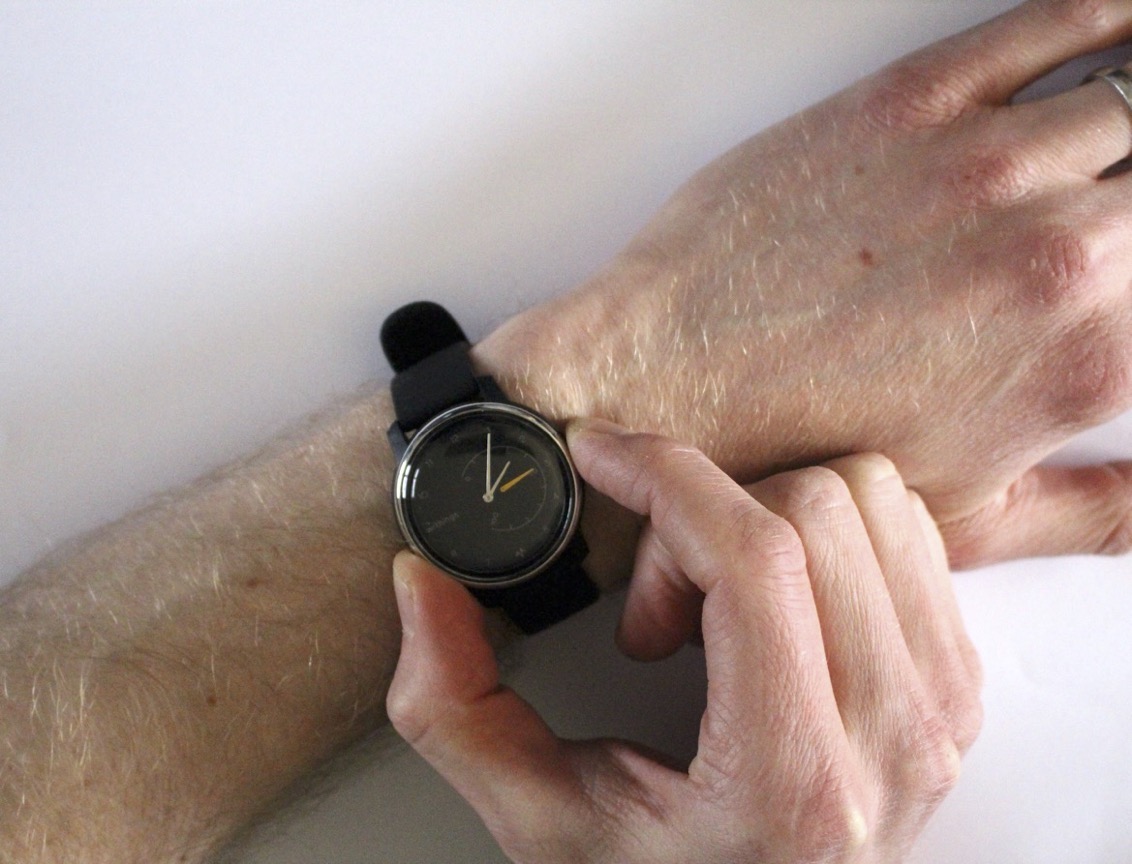
Fig. 11 Recording a single-lead ECG at the wrist. A Withings Move-ECG watch.
A single-lead ECG (shown in Fig. 12 below) can be used to assess heart rhythm, and to assess some aspects of heart functionality.
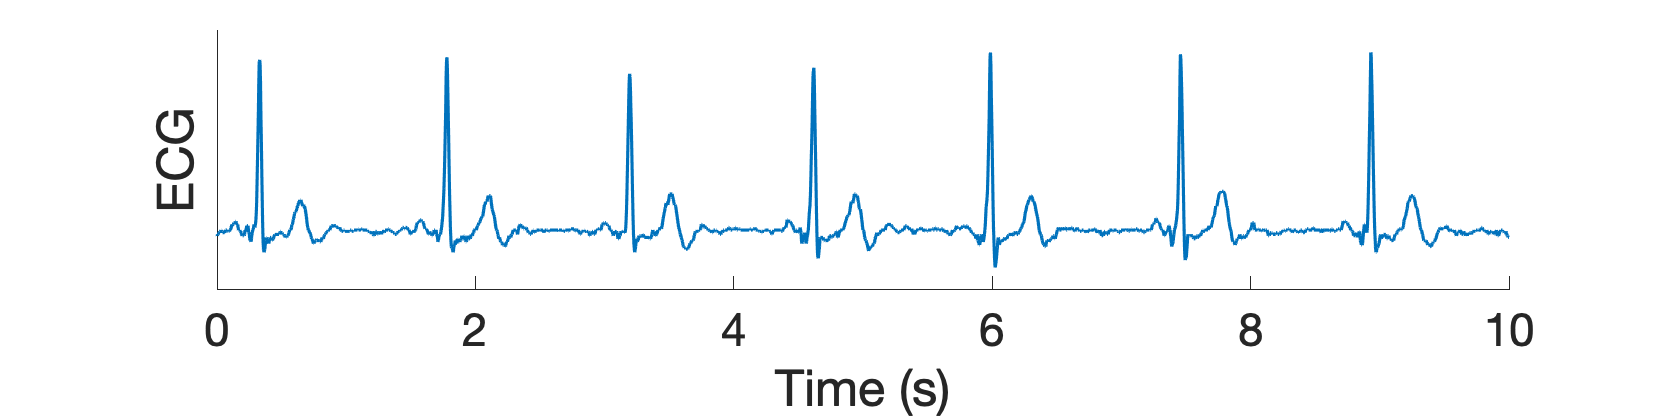
Fig. 12 Single-lead ECG recorded at the wrist. Measured using a Withings Move-ECG watch.
Photoplethysmogram
Photoplethysmography sensors measure changes in blood volume over time. A photoplethysmogram (PPG) signal is acquired by using an LED to shine light onto the skin (Fig. 13), and then measuring the amount of light either reflected from the skin (in the case of a wrist-worn device) or transmitted through the tissue (in the case of a pulse oximeter).
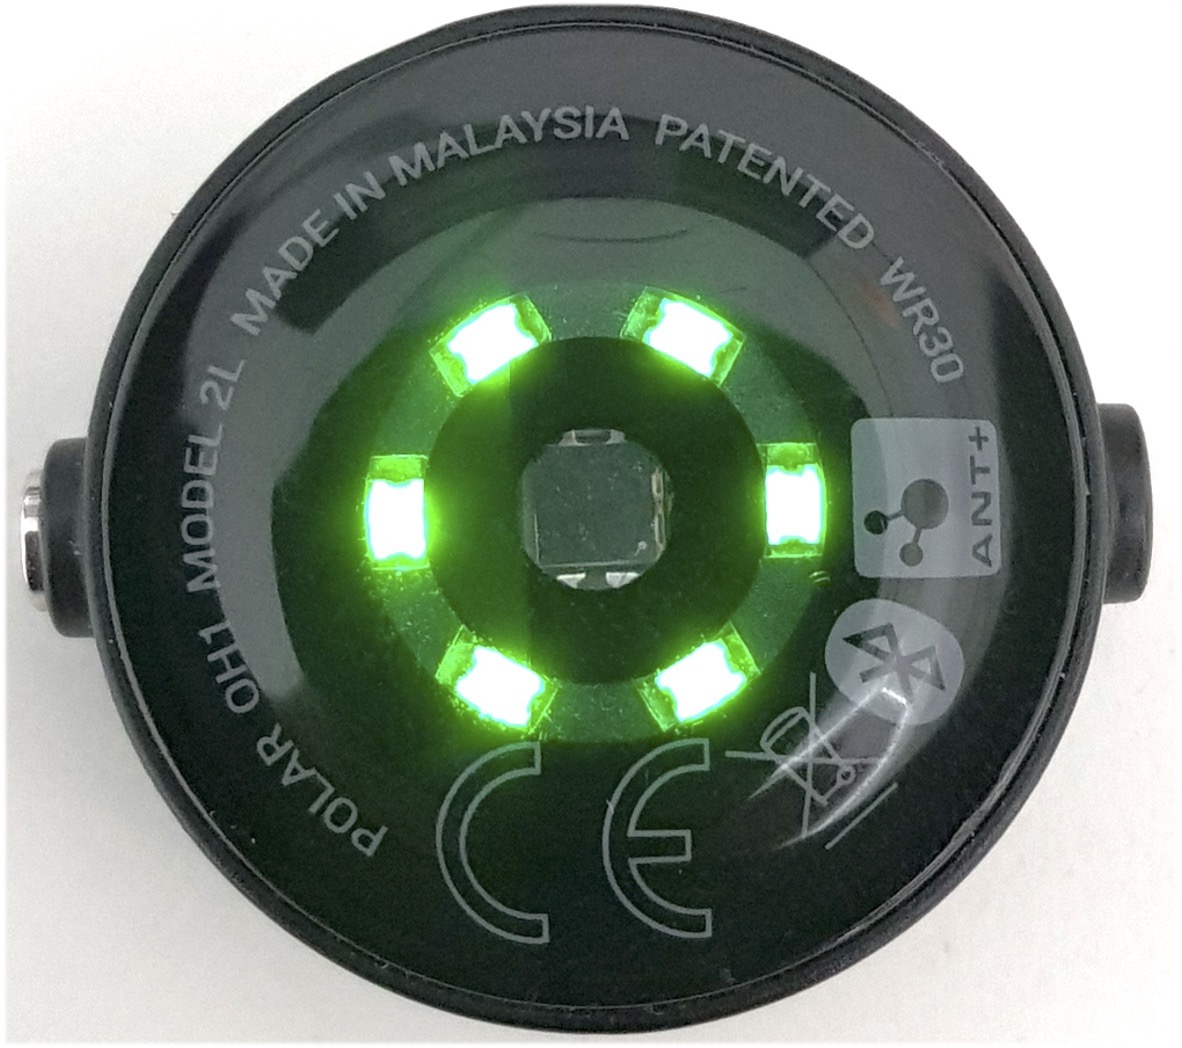
Fig. 13 A photoplethysmogram (PPG) sensor. Source: Marozas V and Charlton PH, Wearable photoplethysmography devices, Wikimedia Commons (CC BY 4.0).
The PPG signal, shown in Fig. 14 below, exhibits a peak for each heart beat, caused by blood volume increasing and decreasing as blood pressure increases and decreases with each heart beat. PPG sensors are more expensive and consume more power than accelerometers and ECG sensors. However, they have the advantage that they can unobtrusively measure signals, unlike wrist ECG sensors which require the user to interact with the device whilst a signal is being measured. Consequently, photoplethysmography sensors are widely used in consumer wearables to monitor heart rate, heart rate variability, and heart rhythm.

Fig. 14 Photoplethysmogram (PPG) signals at rest and during exercise. Source: Charlton PH, Photoplethysmogram signals at rest and during exercise, Wikimedia Commons (CC BY 4.0).
Note how the PPG signal is highly susceptible to noise, as shown in the lower panel of Fig. 14. Here, the signal is contaminated with motion artifact caused by walking.
Blood pressure
The blood pressure signal is not widely measured by wearables. It is briefly introduced here to outline the physiology underpinning the signal, and for comparison with the PPG signal.
The pressure within the arteries varies with the pumping of blood each heart beat. When measured continuously, the blood pressure is a pulsatile signal, varying between systolic (maximum) and diastolic (minimum) pressures, as shown in Fig. 15.

Fig. 15 A blood pressure signal recorded from a critically-ill patient. Data extracted from the MIMIC Waveform Database (v.2).
Fig. 16 shows a comparison of photoplethysmogram (PPG) and blood pressure signals. The two signals do share similarities, particularly in the timing of pulse waves. However, the pulse wave morphologies differ slightly between the signals, such as the different appearances of the diastolic peaks, and the differing nature of the diastolic decay shown particularly clearly in the ectopic beat (at time 2.5-3.2 s).
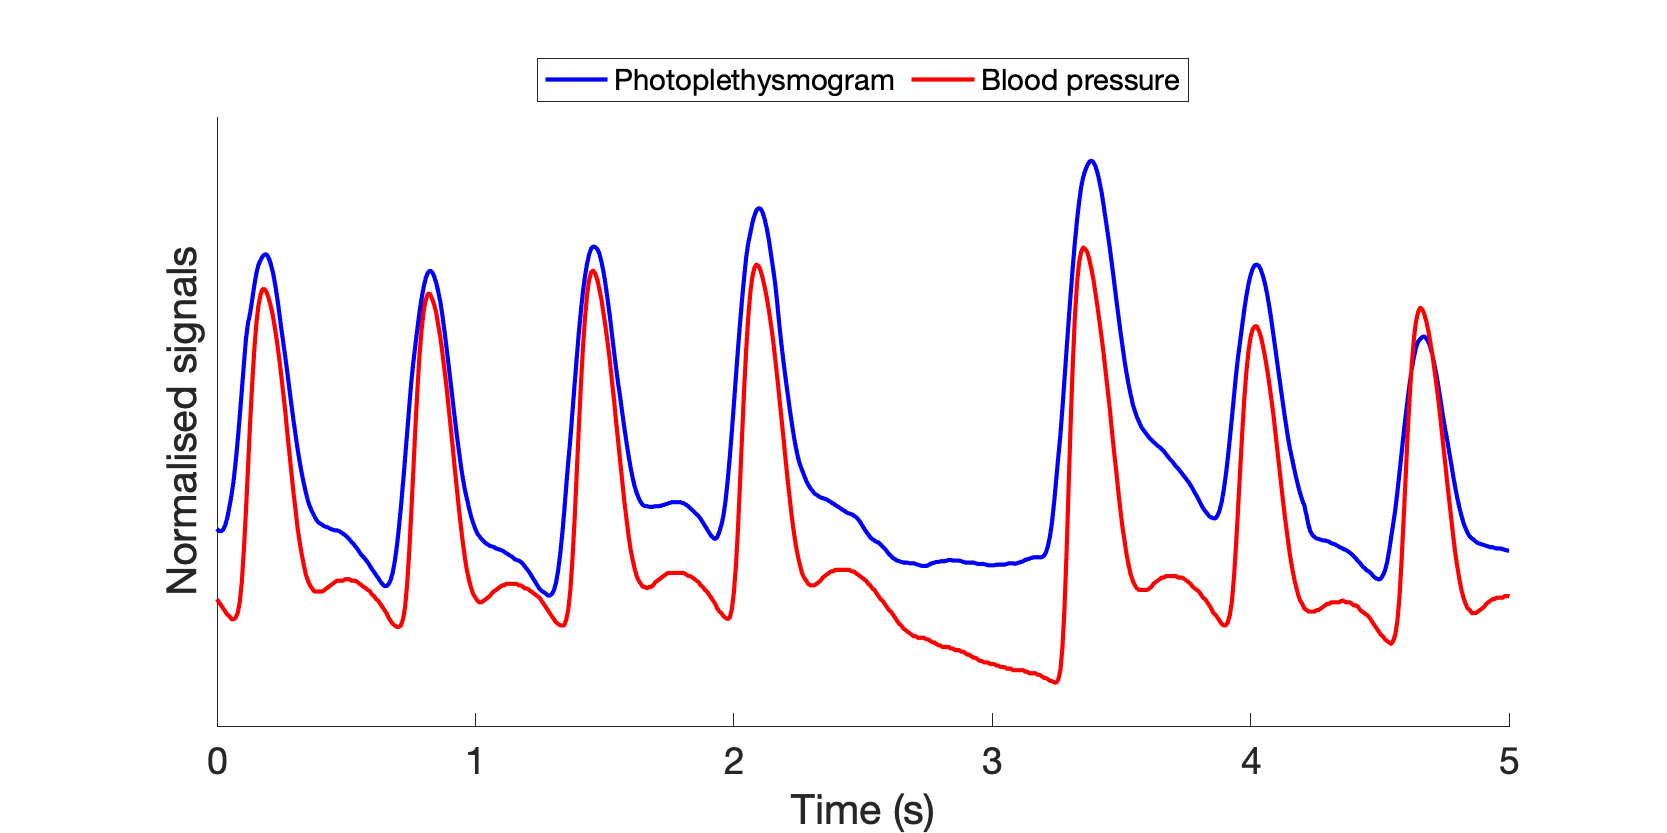
Fig. 16 Comparison of photoplethysmogram (PPG) and blood pressure signals. Data extracted from the MIMIC Waveform Database (v.2).