Signal quality assessment
In this tutorial we will assess the quality of MIMIC waveform signals.
Our objectives are to:
Understand a template-matching approach to assess signal quality of cardiovascular signals.
Apply the template-matching approach to ECG and PPG signals.
Understand how to interpret the results.
Context: Physiological signals can be subject to noise from multiple sources. Signal quality assessment algorithms assess the quality of signals to determine whether they are of sufficient quality for a particular purpose (such as heart rate estimation). In this tutorial we will use the template-matching signal quality assessment algorithm described in this publication.
Extension: If you want to find out more about photoplethysmography (PPG) signal quality assessment then I'd recommend this publication.
Setup
Import packages
The following steps have been covered in previous tutorials. We’ll just re-use the previous code here.
# Packages
from scipy import signal
import numpy as np
import matplotlib.pyplot as plt
!pip install wfdb==4.0.0
import wfdb

# import sys
# from pathlib import Path
Import ECG beat detectors
!pip install py-ecg-detectors
Details of MIMIC record to use
Specify details of a MIMIC database record to use in this tutorial
# The name of the MIMIC IV Waveform Database on Physionet
database_name = 'mimic4wdb/0.1.0'

# Segment for analysis
segment_names = ['83404654_0005', '82924339_0007', '84248019_0005', '82439920_0004', '82800131_0002', '84304393_0001', '89464742_0001', '88958796_0004', '88995377_0001', '85230771_0004', '86643930_0004', '81250824_0005', '87706224_0003', '83058614_0005', '82803505_0017', '88574629_0001', '87867111_0012', '84560969_0001', '87562386_0001', '88685937_0001', '86120311_0001', '89866183_0014', '89068160_0002', '86380383_0001', '85078610_0008', '87702634_0007', '84686667_0002', '84802706_0002', '81811182_0004', '84421559_0005', '88221516_0007', '80057524_0005', '84209926_0018', '83959636_0010', '89989722_0016', '89225487_0007', '84391267_0001', '80889556_0002', '85250558_0011', '84567505_0005', '85814172_0007', '88884866_0005', '80497954_0012', '80666640_0014', '84939605_0004', '82141753_0018', '86874920_0014', '84505262_0010', '86288257_0001', '89699401_0001', '88537698_0013', '83958172_0001']
segment_dirs = ['mimic4wdb/0.1.0/waves/p100/p10020306/83404654', 'mimic4wdb/0.1.0/waves/p101/p10126957/82924339', 'mimic4wdb/0.1.0/waves/p102/p10209410/84248019', 'mimic4wdb/0.1.0/waves/p109/p10952189/82439920', 'mimic4wdb/0.1.0/waves/p111/p11109975/82800131', 'mimic4wdb/0.1.0/waves/p113/p11392990/84304393', 'mimic4wdb/0.1.0/waves/p121/p12168037/89464742', 'mimic4wdb/0.1.0/waves/p121/p12173569/88958796', 'mimic4wdb/0.1.0/waves/p121/p12188288/88995377', 'mimic4wdb/0.1.0/waves/p128/p12872596/85230771', 'mimic4wdb/0.1.0/waves/p129/p12933208/86643930', 'mimic4wdb/0.1.0/waves/p130/p13016481/81250824', 'mimic4wdb/0.1.0/waves/p132/p13240081/87706224', 'mimic4wdb/0.1.0/waves/p136/p13624686/83058614', 'mimic4wdb/0.1.0/waves/p137/p13791821/82803505', 'mimic4wdb/0.1.0/waves/p141/p14191565/88574629', 'mimic4wdb/0.1.0/waves/p142/p14285792/87867111', 'mimic4wdb/0.1.0/waves/p143/p14356077/84560969', 'mimic4wdb/0.1.0/waves/p143/p14363499/87562386', 'mimic4wdb/0.1.0/waves/p146/p14695840/88685937', 'mimic4wdb/0.1.0/waves/p149/p14931547/86120311', 'mimic4wdb/0.1.0/waves/p151/p15174162/89866183', 'mimic4wdb/0.1.0/waves/p153/p15312343/89068160', 'mimic4wdb/0.1.0/waves/p153/p15342703/86380383', 'mimic4wdb/0.1.0/waves/p155/p15552902/85078610', 'mimic4wdb/0.1.0/waves/p156/p15649186/87702634', 'mimic4wdb/0.1.0/waves/p158/p15857793/84686667', 'mimic4wdb/0.1.0/waves/p158/p15865327/84802706', 'mimic4wdb/0.1.0/waves/p158/p15896656/81811182', 'mimic4wdb/0.1.0/waves/p159/p15920699/84421559', 'mimic4wdb/0.1.0/waves/p160/p16034243/88221516', 'mimic4wdb/0.1.0/waves/p165/p16566444/80057524', 'mimic4wdb/0.1.0/waves/p166/p16644640/84209926', 'mimic4wdb/0.1.0/waves/p167/p16709726/83959636', 'mimic4wdb/0.1.0/waves/p167/p16715341/89989722', 'mimic4wdb/0.1.0/waves/p168/p16818396/89225487', 'mimic4wdb/0.1.0/waves/p170/p17032851/84391267', 'mimic4wdb/0.1.0/waves/p172/p17229504/80889556', 'mimic4wdb/0.1.0/waves/p173/p17301721/85250558', 'mimic4wdb/0.1.0/waves/p173/p17325001/84567505', 'mimic4wdb/0.1.0/waves/p174/p17490822/85814172', 'mimic4wdb/0.1.0/waves/p177/p17738824/88884866', 'mimic4wdb/0.1.0/waves/p177/p17744715/80497954', 'mimic4wdb/0.1.0/waves/p179/p17957832/80666640', 'mimic4wdb/0.1.0/waves/p180/p18080257/84939605', 'mimic4wdb/0.1.0/waves/p181/p18109577/82141753', 'mimic4wdb/0.1.0/waves/p183/p18324626/86874920', 'mimic4wdb/0.1.0/waves/p187/p18742074/84505262', 'mimic4wdb/0.1.0/waves/p188/p18824975/86288257', 'mimic4wdb/0.1.0/waves/p191/p19126489/89699401', 'mimic4wdb/0.1.0/waves/p193/p19313794/88537698', 'mimic4wdb/0.1.0/waves/p196/p19619764/83958172']

# Segment 0 is helpful for filtering, and 3 and 8 are helpful for differentiation
rel_segment_n = 0
rel_segment_name = segment_names[rel_segment_n]
rel_segment_dir = segment_dirs[rel_segment_n]

rel_segment_n = 8
rel_segment_name = segment_names[rel_segment_n]
rel_segment_dir = segment_dirs[rel_segment_n]
Signal quality assessment algorithm settings
Threshold to distinguish between high and low quality data.
thresh = 0.66 # For ECG, from: Orphanidou C et al., Signal-quality indices for the electrocardiogram and photoplethysmogram: derivation and applications to wireless monitoring. IEEE J Biomed Heal Informatics 2015;19:832–838. https://doi.org/10.1109/JBHI.2014.2338351
Define template matching functions
filter_ecg- normalises and applies a ~1-15 Hz Butterworth band-pass filter
def filter_ecg(x, fs):
    sig = x
    # sig = sig[:,0]
    order = 3
    low_cutoff = 1  # in Hz
    high_cutoff = 15  # in Hz
    cutoff_frequency = (low_cutoff, high_cutoff)
    b, a = signal.butter(order, cutoff_frequency, btype='band', fs=fs)
    # b, a = signal.butter(3, [0.004, 0.06], 'band')    # original
    sig = signal.filtfilt(b, a, sig, padlen=150)
    sig = (sig - min(sig)) / (max(sig) - min(sig))
    return sig
detect_beats- detects beats in the ECG signal
from ecgdetectors import Detectors

def detect_beats(sig, fs):

    # detect beats
    detectors = Detectors(fs)
    #beats = detectors.swt_detector(sig)
    #beats = detectors.wqrs_detector(sig)
    beats = detectors.hamilton_detector(sig)

    # find R-peaks
    tol_secs = 0.15
    tol_samps = np.floor(fs*tol_secs)
    for beat_no in range(0,len(beats)-1):
            min_el = int(max([0, beats[beat_no]-tol_samps]))
            max_el = int(min([len(sig), beats[beat_no]+tol_samps]))
            curr_samps = sig[min_el:max_el+1]
            beats[beat_no] = int(beats[beat_no]-tol_samps+np.argmax(curr_samps))
    return beats
find_rr_ints- finds RR intervals from beat indices
def find_rr_ints(beats,fs):

    rr_int = []
    for beat_no in range(0,len(beats)-1):
        rr_int.append((1/fs)*(beats[beat_no+1]-beats[beat_no]))   # in secs

    return rr_int
assess_feasibility- assesses feasibility of beat detections
def assess_feasibility(beats):

    feas = 1

    # find HR
    hr = 60*len(beats)/((beats[-1]-beats[0])/fs)  # in bpm

    # check HR
    if hr < 40 or hr > 180:
        feas = 0

    # find RR intervals
    rr_int = find_rr_ints(beats,fs)   # in secs

    # check max RR interval
    if max(rr_int) > 3:
        feas = 0

    # check max to min RR interval
    rr_int_ratio = max(rr_int)/min(rr_int)
    if rr_int_ratio >= 2.2:
        feas = 0

    return feas
calculate_med_rr_int- calculates the median RR interval (in samples)
def calculate_med_rr_int(beats):

    # find RR intervals
    rr_int = find_rr_ints(beats,1)   # in samples

    # find median RR interval
    med_rr_int = np.median(rr_int)

    return med_rr_int
calculate_template- calculates a template beat shape
def calculate_template(sig, beats):

    # find median rr interval
    med_rr_int = calculate_med_rr_int(beats)

    # find no. samples either side of beat
    tol = int(np.floor(med_rr_int/2))
    sum_waves = np.zeros(1+2*tol)
    no_beats_used = 0
    for beat_no in range(0,len(beats)-1):
            min_el = beats[beat_no]-tol
            max_el = beats[beat_no]+tol
            if min_el < 0 or max_el > beats[-1]:
                continue
            curr_samps = sig[min_el:max_el+1]
            for i in range(0,len(sum_waves)):
                sum_waves[i] += curr_samps[i]
            no_beats_used +=1
    templ = sum_waves/no_beats_used
    return templ
calculate_cc- calculates average correlation coefficient between template beat shape and individual beat shapes
def calculate_cc(sig, beats, templ):

    # find median rr interval
    med_rr_int = calculate_med_rr_int(beats)

    # find no. samples either side of beat
    tol = int(np.floor(med_rr_int/2))

    # calculate correlation coefficients for each beat
    sum_cc = 0
    no_beats_used = 0
    for beat_no in range(0,len(beats)-1):
            min_el = beats[beat_no]-tol
            max_el = beats[beat_no]+tol
            if min_el < 0 or max_el > beats[-1]:
                continue
            curr_samps = np.zeros(1+2*tol)
            for i in range(0, 1+2*tol):
                curr_samps[i] += sig[min_el+i]
            temp = np.corrcoef(curr_samps, templ)
            curr_cc = temp[0,1]
            sum_cc = np.add(sum_cc, curr_cc)
            no_beats_used +=1

    # find average correlation coefficient
    cc = sum_cc/no_beats_used
    return cc
compare_cc_to_thresh- compares the average correlation coefficient to a threshold to determine whether the signal is of high or low quality
def compare_cc_to_thresh(cc, thresh):

    if cc >= thresh:
        qual = 1
    else:
        qual = 0

    return qual
assess_qual- assesses the quality of a 10 second window of ECG signal
def assess_qual(x, fs, thresh):

    # filter ECG
    sig = filter_ecg(x, fs)

    # detect beats
    beats = detect_beats(sig, fs)

    # assess feasibility of beat detections
    feas = assess_feasibility(beats)
    if feas == 0:
        qual = 0
        return qual

    # create template beat shape
    templ = calculate_template(x, beats)

    # calculate correlation coefficient
    cc = calculate_cc(x, beats, templ)

    # compare correlation coefficient to threshold
    qual = compare_cc_to_thresh(cc, thresh)

    return qual
Extract one minute of ECG and PPG signals from the MIMIC database
Extract data
These steps have been covered in previous tutorials, so we’ll just re-use the code here.
# Specify the segment of data to be loaded
start_seconds = 20 # time since the start of the segment at which to begin extracting data
n_seconds_to_load = 60

# Load metadata for this record
segment_metadata = wfdb.rdheader(record_name=rel_segment_name, pn_dir=rel_segment_dir)
fs = round(segment_metadata.fs)
print(f"Metadata loaded from segment: {rel_segment_name}")

# Load data from this record
sampfrom = fs*start_seconds
sampto = fs*(start_seconds + n_seconds_to_load)
segment_data = wfdb.rdrecord(record_name=rel_segment_name,
                             sampfrom=sampfrom,
                             sampto=sampto,
                             pn_dir=rel_segment_dir)
print(f"{n_seconds_to_load} seconds of data extracted from: {rel_segment_name}")

# Extract the PPG signal
sig_no = segment_data.sig_name.index('Pleth')
ppg = segment_data.p_signal[:,sig_no]
sig_no2 = segment_data.sig_name.index('II')
ecg = segment_data.p_signal[:,sig_no2]
fs = segment_data.fs
print(f"Extracted the PPG and ECG signals from columns {sig_no} and {sig_no2} of the matrix of waveform data.")
Metadata loaded from segment: 88995377_0001
60 seconds of data extracted from: 88995377_0001
Extracted the PPG and ECG signals from columns 4 and 2 of the matrix of waveform data.
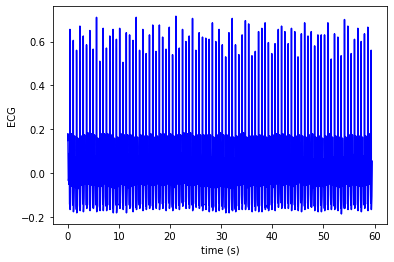
Plot data
Full duration of signal
t = np.arange(0, (len(ecg) / fs), 1.0 / fs)
plt.plot(t, ecg, color = 'blue', label='ECG')
plt.xlabel('time (s)')
plt.ylabel('ECG')
plt.show()
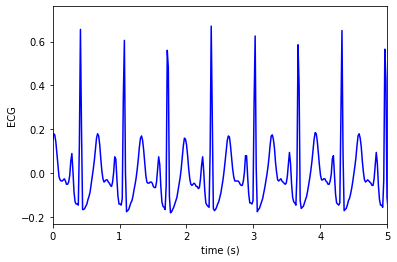
Just a short segment
plt.plot(t, ecg, color = 'blue', label='ECG')
plt.xlabel('time (s)')
plt.ylabel('ECG')
plt.xlim(0,5)
plt.show()
Assess signal quality of this sample data
Using the functions defined above:
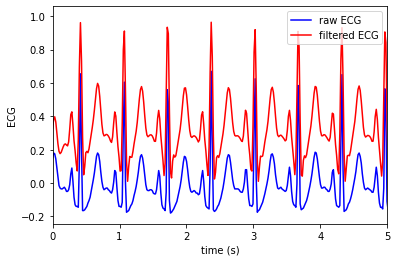
filter the ECG
sig = filter_ecg(ecg, fs)
Plot the result
t = np.arange(0, (len(ecg) / fs), 1.0 / fs)
plt.plot(t, ecg, color = 'blue', label='raw ECG')
plt.plot(t, sig, color = 'red', label='filtered ECG')
plt.xlim([0, 5])
plt.xlabel('time (s)')
plt.ylabel('ECG')
plt.legend()
plt.show()
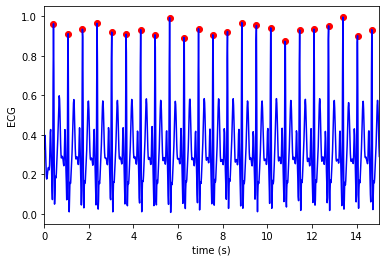
detect beats
beats = detect_beats(sig, fs)
Plot the result
t = np.arange(0, (len(ecg) / fs), 1.0 / fs)
plt.plot(t, sig, color = 'blue', label='ECG')
plt.scatter(t[beats], sig[beats], color = 'red', marker = 'o', label='beats')
plt.xlim([0, 15])
plt.xlabel('time (s)')
plt.ylabel('ECG')
plt.show()
assess feasibility of beat detections
feas = assess_feasibility(beats)
print(f'feas (1 indicates feasible): {feas}')
feas (1 indicates feasible): 1
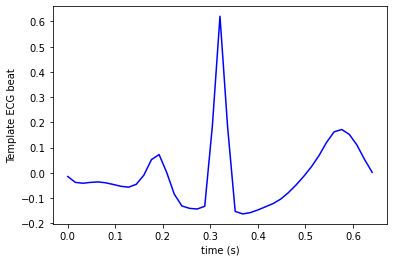
create template beat shape
templ = calculate_template(ecg, beats)
durn = (len(templ)-1)/fs
durn = durn+0.01
t = np.arange(0, durn, 1.0 / fs)
plt.plot(t, templ, color = 'blue', label='Template ECG beat')
plt.xlabel('time (s)')
plt.ylabel('Template ECG beat')
plt.show()
calculate correlation coefficient
cc = calculate_cc(ecg, beats, templ)
print(f'Corr coeff: {cc}')
Corr coeff: 0.9606167664715456
compare correlation coefficient to threshold
qual = compare_cc_to_thresh(cc, thresh)

if feas == 0:
        qual = 0
print(f'quality (1 indicates high quality): {qual}')
quality (1 indicates high quality): 1
Question: What value of correlation coefficient would result in this being low quality?
Re-do quality assessment using single function
qual = assess_qual(ecg, fs, thresh)
print(f'quality (1 indicates high quality): {qual}')
quality (1 indicates high quality): 1
Extension 1: How could we extend this to assess the quality of PPG signals? Consider what threshold would be required (see the original publication) and how the code would need to be adjusted.
Further reading: this book chapter provides further information on PPG signal quality assessment.