QRS peak detection
Detection of cardiac cycles from ECG signals
# setup
import sys
import numpy as np
import scipy.signal as sp

from matplotlib import pyplot as plt

import wfdb
Download records
Identify and download records in the MIMIC III Waveform Database
# Select the first record
selected_record = '3000063_0013'
database_name = 'mimic3wdb/1.0/30/3000063/'
print("Selected record: {}".format(selected_record))

# load data from this record
start_seconds = 20
no_seconds_to_load = 10
fs = 125
record_data = wfdb.rdrecord(record_name = selected_record, sampfrom = fs*start_seconds, sampto = fs*(start_seconds + no_seconds_to_load), pn_dir = database_name)
print("{} seconds of data loaded from: {}".format(no_seconds_to_load, selected_record))

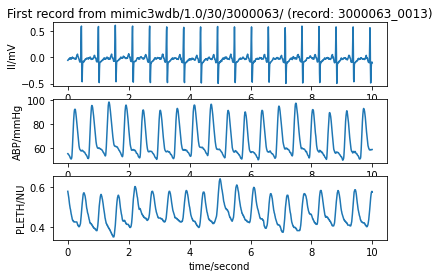
# Plot the data loaded from this record
title_text = "First record from " + database_name + " (record: " + selected_record + ")"
wfdb.plot_wfdb(record=record_data, title=title_text, time_units='seconds')
Selected record: 3000063_0013
10 seconds of data loaded from: 3000063_0013

Separate records
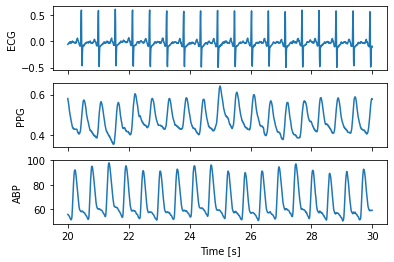
Separate ECG, PPG and ABP signals
# ECG, PPG and ABP extraction
h = 0
for i in record_data.sig_name:
    if i == 'II':
        print('ECG at position ' + str(h))
        ecg = record_data.p_signal[:,h]
    elif i == 'PLETH':
        print('PPG at position ' + str(h))
        ppg = record_data.p_signal[:,h]
    elif i == 'ABP':
        print('ABP at position ' + str(h))
        abp = record_data.p_signal[:,h]
    else:
        print('Other signal (' + i + ') at position ' + str(h))
    h = h + 1

t = np.arange(start_seconds,(start_seconds + no_seconds_to_load),1.0/fs)

fig, (ax1,ax2,ax3) = plt.subplots(3, 1, sharex = True, sharey = False)
ax1.plot(t, ecg)
ax1.set(xlabel = '', ylabel = 'ECG')
ax2.plot(t, ppg)
ax2.set(xlabel = '', ylabel = 'PPG')
ax3.plot(t, abp)
ax3.set(xlabel = 'Time [s]', ylabel = 'ABP')
ECG at position 0
ABP at position 1
PPG at position 2
[Text(0.5, 0, 'Time [s]'), Text(0, 0.5, 'ABP')]

# Remove NaNs
x, = np.where(np.isnan(ecg))
if len(x) != 0:
    print('NaNs in ECG: ' + str(x))
    for i in x:
        ecg[i] = ecg[i - 1]
x, = np.where(np.isnan(ppg))
if len(x) != 0:
    print('NaNs in PPG: ' + str(x))
    for i in x:
        ppg[i] = ppg[i - 1]
x, = np.where(np.isnan(abp))
if len(x) != 0:
    print('NaNs in ABP: ' + str(x))
    for i in x:
        abp[i] = abp[i - 1]
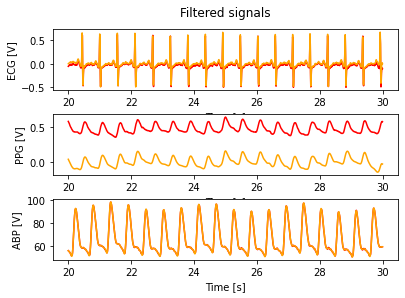
Filter data
# Filter ECG
sos_ecg = sp.butter(10, [0.5, 40], btype = 'bp', analog = False, output = 'sos', fs = fs)
ecg_ff = sp.sosfiltfilt(sos_ecg, ecg)

# Filter PPG
sos_ppg = sp.butter(10, [0.2, 10], btype = 'bp', analog = False, output = 'sos', fs = fs)
ppg_ff = sp.sosfiltfilt(sos_ppg, ppg)

# Filter ABP
sos_abp = sp.butter(10, 10, btype = 'low', analog = False, output = 'sos', fs = fs)
abp_ff = sp.sosfiltfilt(sos_abp, abp)

fig, (ax1,ax2,ax3) = plt.subplots(3, 1, sharex = False, sharey = False)
fig.suptitle('Filtered signals')

ax1.plot(t, ecg, color = 'red')
ax1.plot(t, ecg_ff, color = 'orange')
ax1.set_xlabel('Time [s]')
ax1.set_ylabel('ECG [V]')

ax2.plot(t, ppg, color = 'red')
ax2.plot(t, ppg_ff, color = 'orange')
ax2.set_xlabel('Time [s]')
ax2.set_ylabel('PPG [V]')

ax3.plot(t, abp, color = 'red')
ax3.plot(t, abp_ff, color = 'orange')
ax3.set_xlabel('Time [s]')
ax3.set_ylabel('ABP [V]')

plt.subplots_adjust(left = 0.1,
                    bottom = 0.1,
                    right = 0.9,
                    top = 0.9,
                    wspace = 0.4,
                    hspace = 0.4)

#plt.show()

QRS detection
Define QRS detector functions
# QRS detection function
def qrs_detect(ecg,fs,w):
    """

    Description: QRS peak detection and correction
    Inputs:  ecg, array with ECG signal [user defined units]
             fs, sampling rate of signal [Hz]
             w, window length for analysis [s]
    Outputs: qrs, positions of R peaks [number of samples]
             n_int, number of intervals of length w in the signal

    Libraries: NumPy (as np), SciPy (Signal, as sp), Matplotlib (PyPlot, as plt)

    Version: 1.0 - June 2022

    Developed by: Elisa Mejía-Mejía
                   City, University of London

    """

    # Normalization of ECG
    ecg_n = (ecg - np.min(ecg))/(np.max(ecg) - np.min(ecg))
    ecg_n = ecg_n - np.mean(ecg_n)

    # Peak detection in windows of length w
    n_int = np.floor(len(ecg)/(w*fs))
    for i in range(int(n_int)):
        start = i*fs*w
        stop = (i + 1)*fs*w - 1
        #print('Start: ' + str(start) + ', stop: ' + str(stop))
        aux = ecg_n[range(start,stop)]
        locs, amps, nlocs = rpeakdetect(aux,fs,0.2)
        locs = locs + start
        if i == 0:
            qrs = locs
        else:
            qrs = np.append(qrs,locs)
    if n_int*fs*w != len(ecg_n):
        start = stop + 1
        stop = len(ecg_n)
        aux = ecg_n[range(start,stop)]
        if len(aux) > 20:
            locs, amps, nlocs = rpeakdetect(aux,fs,0.2)
            locs = locs + start
            qrs = np.append(qrs,locs)

    # Peak correction
    # (1) Not peaks
    med_rr = np.median(np.diff(qrs))
    med_amp = np.median(ecg[qrs])
    pos_for = 0
    pos_rev = 0
    for i in range(len(qrs)):
        cur_amp = ecg[qrs[i]]
        if i == 1:                 # Peak is at the first position of the signal
            next_amp = ecg[qrs[i] + 1]
            cond = cur_amp >= next_amp
            #print(cur_amp, next_amp, cond)
        elif i == len(ecg):        # Peak is at the last position of the signal
            prev_amp = ecg[qrs[i] - 1]
            cond = cur_amp >= prev_amp
            #print(cur_amp, prev_amp, cond)
        else:
            next_amp = ecg[qrs[i] + 1]
            prev_amp = ecg[qrs[i] - 1]
            cond = cur_amp >= prev_amp and cur_amp >= next_amp
            #print(cur_amp, prev_amp, next_amp, cond)

        if not(cond):
            # Forward search
            j = qrs[i] + 1
            if i == len(qrs) - 1:
                stop = len(ecg)
            else:
                stop = qrs[i + 1]
            while j < stop:
                cur_amp = ecg[j]
                next_amp = ecg[j + 1]
                prev_amp = ecg[j - 1]
                if not(cur_amp > next_amp and cur_amp > prev_amp):
                    j = j + 1
                else:
                    if ecg[j] >= 0.5*med_amp:
                        pos_for = j
                        j = stop
                    else:
                        j = j + 1
            # Reverse search
            j = qrs[i] - 1
            if i == 0:
                stop = 1
            else:
                stop = qrs[i - 1]
            while j > stop:
                cur_amp = ecg[j]
                next_amp = ecg[j + 1]
                prev_amp = ecg[j - 1]
                if not(cur_amp > next_amp and cur_amp > prev_amp):
                    j = j - 1
                else:
                    if ecg[j] >= 0.5*med_amp:
                        pos_rev = j
                        j = stop
                    else:
                        j = j - 1
            # Selection of peak
            if pos_for != 0 and pos_rev != 0:
                pos = [pos_for, pos_rev]
                if i - 1 == 0:
                    dif = - pos
                else:
                    dif = qrs[i - 1] - pos
                dif_med = np.abs(dif - med_rr)
                #print(dif_med)
                min_dif = np.min(dif_med)
                min_dif, = np.where(dif_med == min_dif)
                #print(min_dif,pos(min_ind))
                qrs[i] = pos(min_ind)

    # (2) Low peaks
    med_amp = np.median(ecg[qrs])
    #print(len(qrs))
    result, = np.where(ecg[qrs] < 0.5*med_amp)
    if len(result) > 0:
        #print(result)
        qrs = np.delete(np.array(qrs),result)
        #print(len(qrs))
    # (3) Too close or too far
    rr = np.diff(qrs)
    avg_rr = np.mean(rr)
    med_rr = np.median(rr)
    q3_rr, q1_rr = np.percentile(rr,[75, 25])
    iqr_rr = q3_rr - q1_rr
    #print(rr, avg_rr, med_rr, q3_rr, q1_rr, iqr_rr)
    if (med_rr < 0.5*fs or avg_rr < 0.5*fs) and (iqr_rr > 0.2*fs):
        result, = np.where(rr <= med_rr)
        qrs = np.delete(qrs, result)
        med_rr = np.median(rr)
    #   (a) Too close
    ind, = np.where(rr < 0.5*med_rr)
    if len(ind) != 0:
        i = 1
        while i <= len(ind):
            ind = no.sort(np.append(ind, ind[i] + 1))
            #print(ind)
            i = i + 2
        qrs = np.delete(qrs, ind)
    #   (b) Too far
    rr = np.diff(qrs)
    ind, = np.where(rr > 1.5*med_rr)
    th_amp = 0.5*np.median(ecg[qrs])
    #print(ind, th_amp)
    if len(ind) != 0:
        i = 0
        while len(ind) != 0:
            #ind = np.round(ind)
            #qrs = np.round(qrs)
            #print(i, ind[i], len(qrs))
            if qrs[ind[i]] == qrs[-1]:
                aux = ecg[qrs[ind[i]]:len(ecg)]
            else:
                aux = ecg[qrs[ind[i]]:qrs[ind[i] + 1]]
            locs, _ = sp.find_peaks(aux)
            ind_del, = np.where(aux[locs] < th_amp)
            locs = np.delete(locs, ind_del)
            if len(locs) == 0:
                new = med_rr + qrs[ind[i]] - 1
            elif len(locs) == 1:
                new = locs + qrs[ind[i]] - 1
            else:
                aux_dif = np.abs(locs - med_rr)
                min_dif = np.min(aux_dif)
                ind_new, = np.where(aux_dif == min_dif)
                new = locs[ind_new] + qrs[ind[i]] - 1
            qrs = np.sort(np.append(qrs, new))
            rr = np.diff(qrs)
            ind, = np.where(rr > 1.5*med_rr)
    rr = np.diff(qrs)
    ind_del, = np.where(rr < 0.3*fs)
    rr = np.delete(rr, ind_del)

    #fig = plt.figure()
    #plt.plot(ecg, color = 'black')
    #plt.scatter(qrs,ecg[qrs],marker = 'o',color = 'red')

    return qrs, n_int
# R peak detect
def rpeakdetect(ecg, fs, th):
    """

    Description: QRS peak detection based on rpeakdetect2.m by G. Clifford
                 A batch QRS detector based upon that of Pan, Hamilton and Tompkins:
                 J. Pan & W. Tompkins. A real-time QRS detection algorithm. IEEE Trans Biomed Eng, vol. BME-32 NO. 3. 1985.
                 P. Hamilton & W. Tompkins. Quantitative Investigation of QRS Detection Rules Using the MIT/BIH Arrythmia
                 Database. IEEE Trans Biomed Eng, vol. BME-33, NO. 12.1986.
    Inputs:  ecg, array with ECG signal [user defined units]
             fs, sampling rate of signal [Hz]
             th, threshold for peaks in integrated waveform - Default: 0.2
    Outputs: locs, positions of R peaks [number of samples]
             amps, amplitudes of R peaks [user defined units]
             nlocs, number of R peaks found

    Libraries: NumPy (as np), SciPy (Signal, as sp), Matplotlib (PyPlot, as plt)

    Version: 1.0 - June 2022

    Developed by: Elisa Mejía-Mejía
                  City, University of London

    """

    # Create time array
    t = np.divide(range(0,len(ecg) - 1), fs)

    # Preprocessing:
    # (1) Filter data
    sos = sp.butter(6, 40, btype = 'low', analog = False, output = 'sos', fs = fs)
    ecg_f = sp.sosfiltfilt(sos, ecg)
    # (2) Differentiate ECG
    ecg_d = np.diff(ecg_f)
    # (3) Square ECG
    ecg_s = ecg_d*ecg_d
    # (4) Integrate data
    if fs >= 256:
        d = np.ones(int(np.round(7*fs/256)))
    else:
        d = np.ones(21)
    ecg_fir = sp.lfilter(d, 1, ecg_s)
    ecg_med = sp.medfilt(ecg_fir, kernel_size = 9)

    # Remove filter delay:
    delay = np.ceil(len(d)/2)
    ecg_med = ecg_med[int(delay):len(ecg_med)]

    # Find peaks:
    # (1) Find highest bumps in data
    start_int = round((len(ecg) - 1)/4)
    stop_int = round(3*(len(ecg) - 1)/4)
    max_h = np.max(ecg_med[start_int:stop_int])
    # (2) Determine left and right boundaries
    ecg_med = np.insert(ecg_med,0,0)
    ecg_med = np.append(ecg_med,0)
    n_left = 0
    n_right = 0
    for i in range(len(ecg_med)):
        if i > 0 and i < len(ecg_med):
            if ecg_med[i] > (th*max_h) and ecg_med[i - 1] < (th*max_h): # left boundary
                if n_left == 0:
                    left_bound = i - 1
                    n_left = 1
                else:
                    left_bound = np.append(left_bound,i - 1)
            if ecg_med[i] > (th*max_h) and ecg_med[i + 1] < (th*max_h): # right boundary
                if n_right == 0:
                    right_bound = i - 1
                    n_right = 1
                else:
                    right_bound = np.append(right_bound,i - 1)
    #print(left_bound)
    #print(right_bound)
    # (4) Look through all possibilities
    if left_bound[0] > right_bound[0]:
        right_bound = np.delete(right_bound,0)
    if left_bound[-1] > right_bound[-1]:
        left_bound = np.delete(left_bound,0)
    nlocs = 0
    for i in range(len(left_bound)):
        #print(i)
        lb = left_bound[i]
        rb, = np.where(np.array(right_bound) > lb)
        if len(rb) != 0:
            rb = right_bound[rb[0]]
            #print(lb, rb)

            amp = np.max(ecg[lb:rb])
            pos, = np.where(np.array(ecg[lb:rb]) == np.amax(ecg[lb:rb]))
            pos = pos[0]
            pos = int(pos + lb)
            #print(pos, amp)
            if nlocs == 0:
                locs = pos
                amps = ecg[pos]
            else:
                locs = np.append(locs, pos)
                amps = np.append(amps, ecg[pos])
            nlocs = nlocs + 1
            #print(locs)

    #fig = plt.figure()
    #plt.plot(ecg)
    #plt.plot(ecg_f)
    #plt.plot(ecg_d)
    #plt.plot(ecg_s)
    #plt.plot(ecg_fir)
    #plt.plot(ecg_med)
    #plt.scatter(locs, amps, marker = 'o')

    return locs, amps, nlocs,
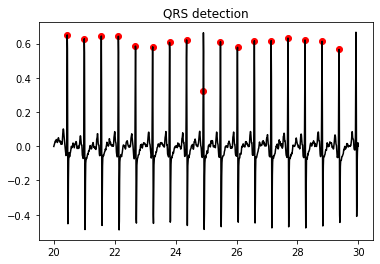
# Detect cardiac cycles
qrs, n_int = qrs_detect(ecg_ff,fs,5)

fig = plt.figure()
plt.title('QRS detection')
plt.plot(t, ecg_ff, color = 'black')
plt.scatter(start_seconds + qrs/fs, ecg_ff[qrs], color = 'red', marker = 'o')
<matplotlib.collections.PathCollection at 0x7fd635e46f10>
